
user manual


MicroBlaze Processor Reference Guide www.xilinx.com 43
UG081 (v6.0) June 1, 2006 1-800-255-7778
Debug and Trace
R
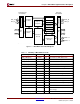
Figure 1-12: FSL used with HW accelerated function f
x
ThismethodissimilartoextendingtheISAwithcustominstructions,but has the benefit of
not makingthe overallspeed of the processor pipeline dependent on the custom function.
Also, there are no additional requirements on the software tool chain associated with this
type of functional extension.
Debug and Trace
Debug Overview
MicroBlaze features a debug interface to support JTAG based software debugging tools
(commonly known as BDM or Background Debug Mode debuggers) like the Xilinx
Microprocessor Debug (XMD) tool. Thedebug interfaceis designed to be connectedto the
XilinxMicroprocessor Debug Module(MDM) core,which interfaceswith theJTAG port of
Xilinx FPGAs. Multiple MicroBlaze instances can be interfaced with a single MDM to
enable multiprocessor debugging. The debugging features include:
• Configurable number of hardware breakpoints and watchpoints and unlimited
software breakpoints
• External processor control enables debug tools to stop, reset, and single step
MicroBlaze
• Read from and write to: memory, general purpose registers, and special purpose
register, except ESR and EAR which can only be read
• Support for multiple processors
• Write to instruction and data caches
Trace Overview
The MicroBlaze trace interface exports a number of internal state signals for performance
monitoring and analysis. Xilinx recommends that users only use the trace interface
through Xilinx developed analysis cores. This interface is not guaranteed to be backward
compatible in future releases of MicroBlaze.
MicroBlaze
Custom HW Accelerator
FSLx
// Configure f
x
cput Rc,RFSLx
// Store operands
put Ra, RFSLx // op 1
put Rb, RFSLx // op 2
// Load result
get Rt, RFSLx
Example code:
Register
File
ConfigReg
Op1Reg Op2Reg
f
x
ResultReg
FSLx