Frequency Generator for Spartan-3E Starter Kit Ken Chapman Xilinx Ltd 18th July 2006 With special thanks to Peter Alfke and Alireza Kaviani. Rev.
Limitations Limited Warranty and Disclaimer. These designs are provided to you “as is”. Xilinx and its licensors make and you receive no warranties or conditions, express, implied, statutory or otherwise, and Xilinx specifically disclaims any implied warranties of merchantability, non-infringement, or fitness for a particular purpose.
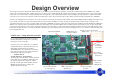
Design Overview This design converts the Spartan-3E Starter Kit into a reasonably accurate frequency generator covering the nominal range 1Hz to 100MHz. The design allows you to attempt generation of higher frequencies to allow you to experiment with the maximum performance of the Spartan device on your board.
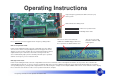
Operating Instructions Output frequency provided on SMA connector (J17) and J4_IO12. LEDs indicate the editing mode. = Edit cursor position mode = Edit digit value mode Press and release knob to toggle between frequency editing modes The cursor can be moved into the 10MHz and 100MHz digit positions but these positions are blanked when zero. The cursor is the small black line under the digit in the top line.
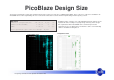
PicoBlaze Design Size The images and statistics on this page show that the design occupies just 172 slices, 1 BRAM and 2 DCMs. This is only 3.7% of the slices available in an XC3S500E device. More significantly, this slice count can be reduced to less than 32 when implementing a fixed frequency version.
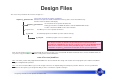
Design Files The source files provided for the reference design are….. frequency_generator.vhd Top level file and main description of hardware. Contains I/O required to disable StrataFLASH memory device on the board which may otherwise interfere with the LCD display. frequency_generator.ucf kcpsm3.vhd fg_ctrl.vhd I/O constraints file for Spartan-3E Starter Kit Timing specifications for 50MHz PicoBlaze controller 200MHz DDS circuits. Location constraint for DCM used for Jitter reduction.
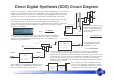
Direct Digital Synthesis (DDS) Circuit Diagram io12 31 frequency_divider[31:0] The phase accumulator is a standard 32-bit accumulator operating at 200MHz. This accumulator is really the heart of the DDS as it is the most significant bit of the accumulator that produces the variable frequency being synthesized. The remaining circuits only multiply, divide and clean this synthesized frequency or are involved with selecting and generating the DDS control words.
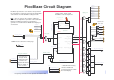
PicoBlaze Circuit Diagram led(2) led(1) 7 led(0) proc_reset JTAG bidirectional LCD data clk input_ports rotary_press_in processor instruction address write_strobe kcpsm3 lcd(7) address instruction address kcpsm3_reset instruction lcd(4) lcd(6) lcd(5) lcd(4) out_port in_port out_port in_port 0 read_strobe clk read_strobe lcd_e 6 port_id port_id clk interrupt lcd_rs lcd_rw write_strobe reset interrupt interrupt_ack 5 [4:0] clk dds_scaling_word D interrupt_control rot
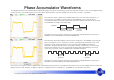
Phase Accumulator Waveforms The following waveforms were obtained by monitoring the output of the phase accumulator presented on stake pin ‘J4-IO9’. In each case the digital storage oscilloscope was set to infinite persistence in order capture any fluctuations over time and therefore observe the ‘envelope’ of operation. This waveform shows a pretty clean 12.5MHz square wave. The reason the waveform is so clean is because 12.
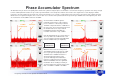
Phase Accumulator Spectrum An alternative way to observe the quality of the waveforms synthesised by the phase accumulator is to look at the frequency spectrum. I was lucky enough to have a 2048-point FFT feature on my oscilloscope which allows some simple observations to be made. Once again I have set the display to infinite persistence in order capture the spectrum over a long period of time (>15 seconds).
Final Output Waveforms These waveforms were obtained from stake pin ‘J4-IO12’ and reflect the final output of the frequency generator. Once again the digital storage oscilloscope was set to infinite persistence in order capture any fluctuations over time and therefore observe the ‘envelope’ of operation. In these cases the frequency shown on the LCD display directly corresponds to the frequency provided at the output.
Final Output Spectrum Observing the frequency spectrum of the final output reveals that you can not get something for nothing and helps us to understand when the frequency aligned mode should and should not be used. I have used the infinite persistence display again and this time it was even more useful to do so. As before, plots on the left cover up to up to 50MHz and on plots on the right show ±5MHz centred on 12.5MHz. 12.5MHz Fundamental 3rd Harmonic These plots show that the 12.
Setting DCM Frequency Aligned Mode To set the DCM into the frequency aligned mode of operation a special option must be used during configuration file generation. This can be set in the ISE tools as shown in these screen shots from an ISE v8.1i project for this reference design. 1) In the ‘Processes’ window select ‘Generate Programming File’. Then right click and select ‘Properties’ to open the ‘Process Properties’ box.
Exercises, Experiments and Suggestions Here are some exercises, experiments and suggestions for you to consider based on this reference design. Although several are specific to the Spartan3E Starter Kit, most are portable to your own boards and designs where I hope you will find the design concept useful.