
User's Manual


Document MV0319P.N
© Xsens Technologies B.V.
MVN User Manual
68
11 Data Analysis
The final stage of the work flow is ‘Data Analysis’. The major feature of the analysis stage is kinematic
graphs.
11.1 Graphs
In the analysis workflow stage, a graph appears in the interface. To view a graph of a given parameter,
click and drag the parameter from tree view to the graph. Two types of graphs are possible: time vs.
parameter and parameter vs. parameter (Coordination [or phase] Plots).
11.1.1 Parameter vs. Time
Drag and drop a parameter with the left mouse button to create a parameter vs. time graph. Click on the
colored boxes in the legend to disable/enable data in a given plane.
11.1.2 Coordination / Phase Plots (Parameter vs. Parameter)
Drag and drop a parameter with the right mouse button to the horizontal or vertical of the graph to create
a parameter vs. parameter graph. Select the variable to plot from the menu. On the remaining axis,
another axis of the parameter will be displayed as default. Repeat the process to plot the desired
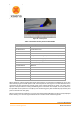
parameter on the remaining axis. See Figure 53 for an example of graph types.
Figure 53: 2D graphs: Time vs. Parameter on the left hand side and parameter vs. parameter on the right
hand side
Note that graphs show the angular velocity in degrees per second. In MVNX files, the angular velocity
is exported in radians per second.