
User's Manual


Document MV0319P.N
© Xsens Technologies B.V.
MVN User Manual
70
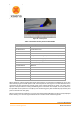
11.1.7 Pan
To use the pan function, enable “no auto scaling”, click in the graph area with the left mouse button and
drag up or down, to pan. Note that it is not possible to pan to an area with no data. When data is available
beyond the limits of the vertical axis it is possible, using the cross bar to pan, and also using a purple
scroll bar, which appears on the side of the graph when there is a large difference between vertical
values, as Figure 54 shows.
Figure 54: Pan and Numerical Values on Graphs
11.1.8 Show/ Hide Legends
Often it is already understood what the colors of the graphs represent. To save room, the legends can
be hidden by toggling the Show / hide legend icon.
11.1.9 Show Numerical Values on Graphs
Using this icon, the numerical value on the graph is visible. It is possible that at times the lines intersect
and the values are not clearly visible, when this happens; remove one line from view by disabling this in
the tick box in the legend. In this way the value of one line at a time is made visible. See Figure 54 for
an impression of how the numerical values appear in the graph.
11.1.10 Equal axes
This tool is used with the phase / coordination plots. Toggle between Equal Axes and “Full Fit” depending
on the detail required.
11.1.11 Amount and layout of graphs
There are a number of pre-defined layouts available, which can be selected from the drop down menu.
Additionally, there is a possibility for the user to define a custom amount and layout of the graphical
representation. When “Custom” is selected, a new area appears where the user can insert the number
of rows by columns to view.