Storm 3 getting started guide V.2.
This guide is a brief overview of the Storm 3 data logger and its basic features. Additional communication options that can be connected to the Storm Central cloud server, including celular modems and GOES satellite transmitter support, are not included in this guide. Please refer to waterlog.com/storm or contact your sales representative for more information. Updated manuals, new firmware updates, brochures, technical notes, and supporting software are available.
Storm 3 Getting Started Guide CONTENTS Get to Know Your Storm 3.............................................2 What’s in the Box..............................................3 Hardware: Left Side.......................................4-5 Hardware: Right Side....................................6-7 Connect to the Storm 3.................................................8 LED Indicators....................................................9 USB Wi-Fi Connection....................................
01 / GET TO KNOW YOUR STORM 3 What’s in the Box Hardware: Left Side Hardware: Right Side 2
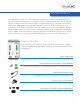
Get to Know Your Storm 3 The WaterLOG® Storm 3 is a mid-range data logger with an ideal cost-to-performance ratio. Built with communications in mind, the Storm 3 supports both internal and external cellular modems and GOES satellite radios. Its balanced set of I/O includes four analog inputs, four independently configurable digital I/O, SDI-12, RS-485 and RS-232 serial connections.
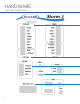
HARDWARE LEFT SIDE CONNECTIONS 4
Get to Know Your Storm 3 Analog There are four analog input channels labeled Vin1 to Vin4. They are grouped in sets of two with each set having a common ground and +5Vref terminal connection. The standard input range for all channels is 0 to 5 volts. The Analog to Digital converter is highly accurate and can accurately measure low level (microvolt) signals. There are two analog ground connection points.
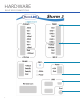
HARDWARE RIGHT SIDE CONNECTIONS 6
Getting To Know Storm 3 Digital I/O The Digital I/O connections can be configured independently as inputs or outputs. In input mode, the signal has an internal pull up resistor of 47K Ohms. This allows a switch closure to ground to activate the input. It can also be driven using normal 5 volt logic levels. Each port can also be set up as a counter input for applications such as a tipping bucket rain gauge. As an output, a100-Ohm protection resistor limits the drive capability.
02 / CONNECT TO THE STORM 3 LED Indicators USB Wi-Fi Connection USB Cable Connection 8
Connect To The Storm 3 The Storm 3 contains a built-in graphical user interface, accessible by either a Wi-Fi or cable connection. No special software is needed to access the user interface. All computers, laptops, tablets, smart phones, and other equipment containing either a Wi-Fi connection or USB port can communicate with and configure the Storm 3 data logger.
USB CONNECTION USB WiFi Connection To wirelessly connect to the Storm 3 data logger, either plug in the USB Wi-Fi adaptor or, if the Wi-Fi adaptor is already connected to the Storm, press the Wi-Fi button on the front of the Storm to enable the Wi-Fi connection. The Storm will begin setting up a Wi-Fi hotspot. After a few seconds an internal LED on the Wi-Fi adaptor will begin blinking, indicating the hotspot connection is ready. The hotspot connection will typically become available within ten seconds.
Connect To The Storm 3 USB Device Cable Connection To connect directly to the Storm data logger, the supplied USB device cable can be used. The first use of the device cable will require a simple driver to be installed for communication. The driver is stored internally on the Storm and becomes available when the USB device cable is plugged in. After the driver has been installed, a new network connection will be established with the Storm. This typically occurs within ten seconds.
03 / USER INTERFACE Home Page Navigation Set Date & Time Adding & Configuring Sensors Enabling Scanning Download Data 12
User Interface Home Page Navigation Once connected to the Storm 3 data logger, the above interface will become available within a web browser. The interface is divided into three main components: Navigation Pane The left side contains the navigation pane and any additional screens. Current Screen Content The right side contains the content for the current screen. Contextual help is available on each screen by clicking the question mark icon in the upper right corner.
SENSORS Adding & Configuring Sensors The Storm 3 data logger uses a set of sensor libraries to quickly and easily configure the system. Sensors can be added and configured by pressing the Sensors button near the bottom of the navigation pane. New sensors can be added by selecting a sensor from the available dropdowns. If a sensor isn’t listed within the library options, the Generic Sensor Type can be used for the sensor type.
User Interface Enabling Scanning After setting up each sensor and enabling the desired output options, scanning should be enabled to begin the measurement and data collection process. On the Home > System Overview screen, next to the System Time, select “Enabled” from the Scanning dropdown box. Downloading Collected data can be easily downloaded directly to your PC or to an attached USB flash drive by pressing the Data button in the navigation pane (directly under the Outputs button).
What Can Xylem Do For You? Xylem 1) The tissue in plants that brings water upward from the roots; 2) a leading global water technology company. We’re 12,900 people unified in a common purpose: creating innovative solutions to meet our world’s water needs. Developing new technologies that will improve the way water is used, conserved, and re-used in the future is central to our work.