
Getting Started Guide Manual


User Interface
13
Once connected to the Storm 3 data logger, the above interface will become available within a
web browser. The interface is divided into three main components:
Navigation Pane
The left side contains the navigation
pane and any additional screens.
Current Screen Content
The right side contains the content for
the current screen. Contextual help is
available on each screen by clicking the
question mark icon in the upper right
corner.
Site ID, Connection and Status
The bottom of each screen contains
the status of “Scanning” (i.e. whether
the data logger is actively taking
measurements, recording data,
transmitting, etc.) as well as the current
connection status.
Set Date and Time
The SiteID, date, and time can all be set
on the initial Home > System Overview
screen. To change any of the settings,
simply click on the current setting and
type in a new value. The date can be set
by using the calendar icon next to the
entry field to more easily select a specific
date.
Pressing enter or leaving the entry box
will cause the values to be saved.
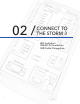
Home Page Navigation
Home Page Navigation
Set Date & Time
Adding & Configuring Sensors
Enabling Scanning
Download Data