
User Manual


Multichannel Monitoring Tutorial Booklet (M2TB) rev. 3.5.2
Masataka Nakahara : SONA Corporation
©2005 YAMAHA Corporation, ©2005 SONA Corporation
53 / 74
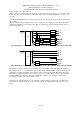
[Fig. 38] LFE vs. C; with Bass Management
[Fig. 39] and [Fig. 40] are examples showing the difference in values when the “center channel playback
level” is subtracted from the “LFE playback level.” [4] [Fig. 39] shows examples of ten different studios
without bass management controllers, while [Fig. 40] shows examples of eleven different studios with
bass management controllers. Since both groups are adjusted as DVD-Video playback environments, it is
necessary that the low-frequency range show a +10 dB difference in values.
It can be seen that the studios not using a bass management controller exhibit a greater disparity ([Fig.
39]) than studios that are using a bass management controller.
[Fig. 39] LFE vs. C, 10 studios ; without Bass Management
[Fig. 40] LFE vs. C, 11 studios ; with Bass Management
0
5
10
15
16
20
25
31.5
40
50
63
80
100
125
160
1/3oct. band frequency [Hz]
SPL [dB]
0
5
10
15
16
20
25
31.5
40
50
63
80
100
125
160
1/3oct. band frequency [Hz]
SPL [dB]
10dB
55
60
65
70
75
80
85
16
20
25
31.5
40
50
63
80
100
125
160
200
250
315
400
500
630
800
1K
1.25k
1.6k
2k
2.5k
3.15k
4k
5k
6.3k
8k
10k
12.5k
16k
20k
1/3oct. band frequency [Hz]
SPL [dB]
LFE
C