
User Manual
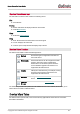
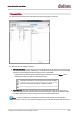
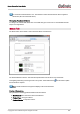
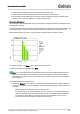
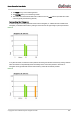
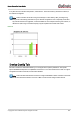
Table Of Contents
- About Audinate
- Introduction
- Installing Dante Controller
- Dante Basics
- Starting Dante Controller
- Using Dante Controller
- Presets
- Troubleshooting
- Fanout
- Messages on Startup
- Computer Configuration Checklist
- Troubleshooting Dante IP Address Configuration
- Troubleshooting Switch Configuration and Cabling
- Index

Dante Controller User Guide
Copyright © 2014 Audinate Pty Ltd. All rights reserved.
-59-
n The Peak latency since measuring started
n The Average latency since measuring started
n The number of measurements taken that included one or more Late packets (note that each meas-
urement typically includes many packets)
Interpreting the Histogram
If all bars are green and falling well within the limit of the histogram (i.e. towards the left or middle of the
histogram), it indicates that the latency setting for the receiver is set high enough to prevent packet loss.
Show me
If any bars are amber, it means that some packets are arriving near the limit of the latency setting. Network
traffic fluctuations could potentially lead to extra delay which could cause packets to arrive late. A
histogram of this type indicates that the receiver latency should be increased if possible.
Show me