
Troubleshooting guide


The Graph
The graph shows the evolution of sound parameters over time. Simply turn the knobs of the
control panel below to view the curves move along.
On the bottom of the graph a real time scale in seconds is displayed. The scale will adjust
automatically to the audible portion of the sound (i.e. the yellow VCA envelope).
The vertical scale is fixed and the meaning depends of the drawn parameter. As a basic rule,
upper side is 'louder', 'brighter' or 'higher pitch'. Lower side is 'quitter', 'darker' or 'lower pitch'.
Lines have the same color than the text of the parameter involved.
For example, all the VCF parameters with a blue text ( envelope amount, cutoff, EG. ) are
represented with the bright blue line.
The yellow curve show the 'VCA EG', or the Amp envelope in more modern words.
The sum of OSC 1 level, OSC 2 level and Noise level gives the maximum height of the curve.
In the above sample, the attack is almost null and the curve is almost instantly at peak level.
Then a medium decay of 15 (which takes 1.8 sec) brings the curve to break point level of 28.
Then a slope of 21 bring the curve to sustain level of 8 at time 3.3".
The dotted portion of the line shows the sustain. It has no duration by itself but the curve is
extended to always show at least one half-second of sustain for both VCA and VCF EG.
Finally, the rounded end of the envelope represents the release time to bring the overall
volume to zero.
The vertical purple lines show the digital delay effect. The effect level changes the initial line
height. The feedback parameter affects the number of repeated lines (echoes). The distance
between lines is related to to the time parameter.
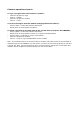
All time related parameters where computed from real measures
of audio recordings (this was quite a task...). So effectively, you
can synchronize envelope, LFO start time and frequency, echoes,
etc... For example, you can easily have the pitch LFO (dark red
saw) start exactly at the end of the auto-bend (bright red line)
like in this snap shot: