Yamaha LAN Monitor User Guide EN Information • The software and this document are the exclusive copyrights of Yamaha Corporation. • Copying or modifying the software or reproduction of this document, by any means, whether in whole or in part, is expressly forbidden without the written consent of Yamaha Corporation.
Contents Information ...............................................................................1 About Yamaha LAN Monitor ...................................................1 Terminology..............................................................................3 Steps to use the software........................................................4 Software operating requirements...........................................4 Notes ............................................................................
[Device search] button..................................................................17 [Snapshots] button........................................................................19 [Notifications] button / “Notification area”.....................................19 [History] button / “History” area ....................................................20 [Whole map] button.......................................................................20 [Dante Controller] button......................................
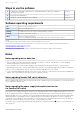
Steps to use the software Steps to use the software 1 Compare the operating requirements for Yamaha LAN Monitor with your computer’s operating environment. page 4 2 Install Yamaha LAN Monitor. page 6 3 Configure network settings on your computer. page 10 Software operating requirements OS macOS 10.13.x/ 10.14.x/ 10.15.
Notes Notes regarding a slave whose stack function is enabled Management of a slave whose stack function is enabled is not supported except. Note that, even though detection is possible, correct information cannot be displayed. Notes on printing and print preview of the "Whole map" Depending on the number of terminals displayed on the Whole map and the execution environment of this software, the "Whole map" may not be printed or previewed correctly.
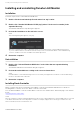
Installing and uninstalling Yamaha LAN Monitor Installing and uninstalling Yamaha LAN Monitor Installation Follow the steps below to install Yamaha LAN Monitor. 1. Double-click the downloaded zip file and extract it to any location. 2. Double-click “Yamaha LAN Monitor VX.X.X.pkg” (where X is the version number) in the expanded directory. The Yamaha LAN Monitor setup dialog box appears. 3. Perform the installation as directed in the screen. NOTE •If the following dialog box appears, click [OK].
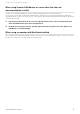
Installing and uninstalling Yamaha LAN Monitor When using Yamaha LAN Monitor as a user other than the user who executed the installer In order to use Yamaha LAN Monitor, the user must belong a group that can capture packets. The user who executed the installer will automatically be given group (lan_monitor_bpf) privileges allowing for capturing packets. However, for other users, it is necessary to perform the following operations and join the group called lan_monitor_bpf. 1.
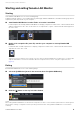
Starting and exiting Yamaha LAN Monitor Starting and exiting Yamaha LAN Monitor Starting Start Yamaha LAN Monitor in one of the following ways. A different startup sequence is used when directly starting up Yamaha LAN Monitor, and when starting it up from a snapshot file (nms file) saved on your computer. Start Yamaha LAN Monitor from the Finder or from the LaunchPad.
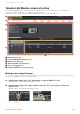
Yamaha LAN Monitor screen structure Yamaha LAN Monitor screen structure The Yamaha LAN Monitor screen lists the current network status in the “Tree” view. Also, you can verify the connection status of the devices, or change some slave settings. The names of each component of the Yamaha LAN Monitor screen are described below.
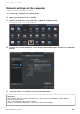
Network settings on the computer Network settings on the computer Configure network settings for your computer. 1. Connect the computer to a network device. 2. Open “System Preferences” of macOS. 3. Click the [Setup] menu on the menu bar [Open IP Settings for PC]. The “Network Connections” window appears. 4. From the list of network adapters, select the wired LAN adapter that you want to use with LAN Monitor. 5. Set the IP address according to your network environment.
Basic operation Basic operation 1. Start Yamaha LAN Monitor. Network adapter selection pull-down menu 2. From the network adapter selection pull-down menu in the toolbar, select the network adapter to which the network that you want to monitor is connected. 3. Click [Setup] in the menu bar [Basic Settings] to configure basic Yamaha LAN Monitor settings. Click [OK] to apply settings.
Basic operation 4. Select the device you wish to monitor in the “Tree” view. 5. Click the [Snapshots] button on the toolbar to use the snapshot function, as needed. Click the [Snapshots] button to save the current network status, issues detected, and other information to Yamaha LAN Monitor as a snapshot.
Menu bar Menu bar This section provides descriptions of each menu on the menu bar: [File], [Setup] and [About]. 1 2 3 4 1 [LANMonitor] menu (page 13) 2 [File] menu (page 13) 3 [Setup] menu (page 14) 4 [About] menu (page 16) [LANMonitor] menu [About LANMonitor] Displays Yamaha LAN Monitor version and copyright information. [File] menu [New] Initializes the current snapshot held by Yamaha LAN Monitor. If a snapshot is already held, a confirm initialization message appears.
Menu bar [Setup] menu [Import Label Settings] Opens the “Import Label Settings” dialog box. Loads device labels displayed in the “Connected Devices” view from a file. [Export Label Settings] Opens the “Export Label Settings” dialog box. Saves device labels specified in the “Connected Devices” view as a file. The saved file has a filename extension of “.nml.” [Basic Settings] Opens the “Basic Settings” dialog box. Displays a dialog box in which you can make basic settings for Yamaha LAN Monitor.
Menu bar 4 Keepalive This pings slaves and devices with an IP address to confirm their existence. This is used to set the ping interval, the wait time for reply, and the number of failed attempts before a connection is assumed to be down. • Interval time: Set the ping interval in seconds. Setting range: 1 – 1800 sec Default: 10 sec • Wait time for reply: Set the wait time for reply to pings in seconds.
Menu bar [About] menu [Leagal] Displays license information for open source software used by Yamaha LAN Monitor.
Toolbar and display area Toolbar and display area This section describes the display area and each button on the toolbar: [Device search], [Snapshots], [Notifications], [History], [Whole map] and [Dante Controller].
Toolbar and display area 1 2 3 1 Ping You can ping one or more specified IP addresses. Select a radio button to specify which type of test you want to execute. Click the [Execute] button to start a ping test. The results of the ping test appear in the Result of searching area. When you select [IP address] and execute a ping test, the Result of searching area displays the test results regardless of whether there is a reply.
Toolbar and display area [Snapshots] button Saves the current network connection status to Yamaha LAN Monitor as a snapshot. Click the [Snapshots] button to display a save snapshot confirmation message. Click [OK] to save the snapshot. NOTE • The snapshot function compares the current network connection status with the previously saved snapshot and displays a message in the Notification area when a change is detected.
Toolbar and display area 1 2 3 1 “Notification area Messages regarding the current network are shown here. When a new message is added, the Notification area appears automatically. The Notification area can also be displayed by clicking the [ ] button. When a message is displayed, you can close the Notification area by clicking the [ ] button. Date/Time: Shows the date and time at which the message was output. Messages: Shows the message that was output by the switch function or snapshot function.
Toolbar and display area 1 2 3 1 Button area • [ ] button: Refreshes the information in the network configuration display area. Click this button to refresh with the latest information. • [ ] button: Displays the print preview screen. You can print the whole map. 2 Legend area • “Date:” Shows the date and time of when the whole map screen or the [Refresh view] button was operated.
Toolbar and display area [Dante Controller] button Starts the Dante Controller that is installed on the computer. Dante settings, such as patching, can be configured. To display this button,Dante Control and Monitoring must be installed (page 6). If Dante Controller is not installed (page 6), an error message appears. For details on using Dante Controller, refer to the Dante Controller User Guide.
Main screen Main screen 1 3 2 1 “Device Details” view (page 23) 2 Tree view (page 26) 3 “Connected Devices” view (page 27) “Device Details” view This shows detailed information about the device that is selected in the tree view. The left side shows detailed information about the device, and the right side shows port information and information on the Dante-enabled device. The displayed contents will vary depending on the device in use.
Main screen 1 Device Details This area shows the following information. Depending on the device, some items will not be shown. “Label” Shows the device label that was entered in the “Device Settings” dialog box or the “Connected Devices” view. “Name” Shows the model name of the device. “Comment” Shows the comment that was entered in the “Connected Devices” view. You can freely enter information about the on-site cabling or the role of the device.
Main screen Sampling frequency/ bit-length/latency Shows the sampling frequency, bit-length, and latency of the audio signal. The latency is shown in μ second units. “Pull-up/down” Shows the sampling rate pull-up/pull-down setting. “Mute” indicator Lit in red when the Dante-enabled device is muted. “Tx”/”Rx” Shows information about Dante transmission and reception. [Utilization]: Shows the current amount of transmission and reception in kbps units.
Main screen 6 [Web GUI] button (shown only for a slave device with a Web GUI) When you click this, the Web GUI of the device currently selected in the tree appears in the default browser. In the Web GUI, you can configure basic settings for Yamaha switch and Yamaha wireless LAN access point and manage them. For details, refer to “Logging in to the Web GUI” (page 29). 7 Button to show/hide device details Click the button to switch whether device details are shown or hidden.
Main screen “Connected Devices” view When you click a Yamaha switch shown in the tree view, a list of the connected devices is shown in the “Connected Devices” view. The “Connected Devices” view is updated each time that the time specified in “Slave monitoring time interval” of “Basic Settings” has elapsed (page 14). When you click the [Refresh] button of the “Connected Devices” view, information for the devices connected to the slave is refreshed.
Main screen [Keepalive] Select this check box to perform keepalive checks on the device. If this check box is selected, Yamaha LAN Monitor pings the device to perform keepalive checks according to settings configured in the “Basic Settings” dialog box (page 14). Selecting this check box will display the following depending on the circumstances. • Checking: Now checking. • UP: Successfully detected device. • DOWN: Failed to detect device.
Web GUI Web GUI If the Yamaha switch provide a web page for configuring settings, you can display this web page in your browser to configure basic settings and perform device management. This web page is referred to as a Web GUI. For more information on recommended browsers for viewing the Web GUI, check the URL below. http://www.rtpro.yamaha.co.jp/RT/FAQ/gui/browser_en.
Resources Resources Port icons in the “Device Details” view You can check the status of each port by checking the icon color and shape of each device port shown in the “Device Details” view. In the “Device Details” view, switch between the [Port Status] tab, the [Bandwidth(%)] tab and the [PoE status (Class)] tabs to show the following icons. NOTE • The [Bandwidth(%)] tab will only show Yamaha switches. • The [PoE status (Class)] tab will only show Yamaha PoE switches.
Resources Icon Meaning Bandwidth from 55% to less than 65% Bandwidth from 45% to less than 55% Bandwidth from 35% to less than 45% Bandwidth from 25% to less than 35% Bandwidth from 15% to less than 25% Bandwidth from 7.5% to less than 15% Bandwidth from 0% to less than 7.5% Abnormality occurred Link down Alert state (SFP port) [PoE status (Class)] tab icons This area shows the power supply status for each port (PoE-enabled Yamaha switches only).
Resources Messages shown in both the Notification area and the History area Messages shown in both the Notification area and the History area are as follows. Switch function error messages The following messages appear when an error occurs with the switch function.
Resources Messages [mac] label: The transmission load has reached the upper limit at port (n) of the Yamaha switch. (QoS transmission queue: x) [mac] label: The transmission load of the Yamaha switch (n) has returned to normal. (QoS transmission queue: x) Dante-related notifications The following messages appear if there is a change in a Dante-enabled device. Messages The word clock of has been unlocked. The word clock of has been locked.
Resources Messages [mac] label: The power that might be supplied exceeds q W. The power being supplied from Yamaha switch might be interrupted according to the condition. [mac] label: Yamaha switch has detected down of portIp (portMac). [mac] label: Yamaha switch has detected portIp (portMac). [mac] label: Yamaha switch has stopped supplying power to portIp (portMac). [mac] label: Yamaha switch has started supplying power to portIp (portMac).
Resources Messages The snapshot file could not be deleted. Error messages Messages There is no OUI file. Backup the necessary information, and re-install. The OUI file could not be loaded. Backup the necessary information, and re-install. The data folder could not be created. Failed to start the specified snapshot file. Messages shown in the Result of searching area for Device search A device search using one or more IP addresses can return the following messages in the Result of searching area. X.X.X.
Troubleshooting Troubleshooting Symptom Cause Action Main screen is not displayed correctly Network adapter selection is incorrect. Select the network adapter that is connected to the network that you want to monitor. Because numerous devices are connected, it is taking a long time to search for devices. This may take several minutes; please wait. Information is shown consecutively, starting with devices for which information gathering has completed.
Troubleshooting Symptom Cause Action Snapshot function does not work A snapshot has not been saved. Click the [Snapshots] button to save the current connection status. A device cannot be the object of snapshot monitoring. • In the “Basic Settings” dialog box, select the “Treat equipment as comparison for snapshots” check box. • In the “Connected Devices” view, select Snapshot for each device. Can’t display the Web GUI The computer’s network settings are not appropriate.