
User Manual


Speaker System Design Guide for
Yamaha Sound System Simulator
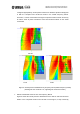
configured appropriately, similar phase interferences between speakers will appear
in both the computed and measured results in the middle frequency bands.
Therefore, it can be concluded that using the computed results of direct sound only
to reduce areas of phase interference will have beneficial effects on the actual
sound field.
500 Hz
1 kHz 2 kHz
Figure 3: Sound pressure distributions by frequency band (middle frequency bands)
(left diagram: the results of Y-S
3
, right diagram: measured results)
¾ Effects of Reflected Sound in the Low Frequency Bands
Figure 4 shows the sound pressure distributions for the 250 Hz and 125 Hz octave
bands. In the computed results on the left side of each figure, no dips caused by
6