
User Manual
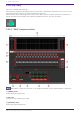
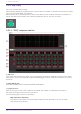
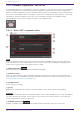
Table Of Contents
- ProVisionaire Design
- Contents
- 1. Introduction
- 2. Audio Components
- 2.1. The Difference Between Mono, Stereo, and Multi
- 2.2. How to Control Control Signals
- 2.3. Acoustic Echo Canceller (AEC)
- 2.4. Ambient Noise Compensator (ANC)
- 2.5. Audio Detector
- 2.6. Auto Gain Control (AGC)
- 2.7. Combiner: Room Combiner, Room Combiner plus Automixer
- 2.8. DCA
- 2.9. Delay
- 2.10. Dynamics: Compressor
- 2.11. Dynamics: Comp260
- 2.12. Dynamics: De-Esser
- 2.13. Dynamics: Ducker
- 2.14. Dynamics: Gate
- 2.15. Dynamics: Limiter
- 2.16. Dynamics: Paging Ducker
- 2.17. Dynamics: Program Ducker
- 2.18. Effect: Ping Pong Delay
- 2.19. Effect: REV-X
- 2.20. EQ: GEQ
- 2.21. EQ: PEQ
- 2.22. Fader
- 2.23. Feedback Suppressor: Notch FBS
- 2.24. Feedback Suppressor: Pitch Shift FBS
- 2.25. Filter: BPF
- 2.26. Filter: HPF
- 2.27. Filter: LPF
- 2.28. Input/Output: Dante In
- 2.29. Input/Output: USB In
- 2.30. Input/Output: Dante Out
- 2.31. Input/Output: USB Out
- 2.32. Input/Output: SD Card
- 2.33. Meter
- 2.34. Mixer: Delay Matrix, Matrix Mixer
- 2.35. Mixer: Dugan Automixer
- 2.36. Oscillator
- 2.37. Polarity
- 2.38. Probe
- 2.39. Router
- 2.40. Source Selector
- 2.41. Speaker Processor: Standard SPP
- 2.42. Speaker Processor: C-Series SPP (FIR)
- 3. Control Components
- 3.1. Control Methods for Control Components
- 3.2. Input (Normalized Value): Button
- 3.3. Input (Value): Button
- 3.4. Input (Normalized Value): Radio Button
- 3.5. Input (Value): Radio Button
- 3.6. Input (Normalized Value): Fader
- 3.7. Input (Value): Fader
- 3.8. Processing (Normalized Value): Logic
- 3.9. Processing (Normalized Value): NOT
- 3.10. Processing (Normalized Value): Flip-Flop
- 3.11. Processing (Normalized Value): Invert
- 3.12. Processing (Normalized Value): Compare
- 3.13. Processing (Normalized Value): Difference
- 3.14. Processing (Normalized Value): Max/Min
- 3.15. Processing (Value): Negate
- 3.16. Processing (Value): Compare
- 3.17. Processing (Value): Multi Compare
- 3.18. Processing (Value): Difference
- 3.19. Processing (Value): Max/Min
- 3.20. Processing: Delay
- 3.21. Processing: External Events
- 3.22. Processing: Suspend
- 3.23. Processing: Router
- 3.24. Controller: GPI In
- 3.25. Controller: GPI Out
- 3.26. Controller: Scheduler
- 3.27. Parameter Set
- 3.28. Snapshot

④ Initial Delay
Duration of time between sound input and the start of reverberation. Higher values delay the start of
reverberation.
⑤ Decay
Shape of reverberation envelope. Reverberation characteristics are determined by the value.
⑥ Room Size
Size of space. Higher values simulate larger spaces. This value is linked with the Reverb Time value.
When you change this value, the Reverb Time value changes.
⑦ Diffusion
Density and spread of reverberation. Higher values increase the density and enhance the spread.
⑧ HPF
This filter cuts the low frequency range of the reverberation. The range below the frequency specified
by this value is cut. This filter does not affect the original source sound.
⑨ LPF
This filter cuts the high frequency range of the reverberation. The range above the frequency
specified by this value is cut. This filter does not affect the original source sound.
⑩ Hi Ratio
Length of reverberation in the high frequency range. The reverberation duration of the high frequency
range is expressed as a ratio relative to Reverb Time.
⑪ Low Ratio
Length of reverberation in the low frequency range. The reverberation duration of the low frequency
range is expressed as a ratio relative to Reverb Time.
⑫ Low Freq
Frequency value that serves as the basis for the Lo Ratio value. The frequency band below this value is
affected by the Lo Ratio parameter setting.
⑬ Filter frequency response curve
The curve changes depending on the HPF and LPF values.
⑭ Reverberation images
These images represent the high-range (10 kHz), mid-range (1 kHz), and low-range (100 Hz)
reverberation. These images change shape depending on the parameter values. The vertical axis
represents the level; the horizontal axis represents reverb time; the shape represents the envelope.
⑮ Reverb time curve
This curve represents the high-range (10 kHz), mid-range (1 kHz), and low-range (100 Hz) reverb time.
The curve changes depending on the Reverb Time, Hi Ratio, and Lo Ratio parameter values.
⑯ Zoom
This field indicates the time duration (in seconds) as displayed by the time axis (horizontal axis).
⑰ Zoom Out button
Increases the time value (in seconds) as displayed by the time axis (horizontal axis). As a result, the
display zooms out on the horizontal axis.
⑱ Zoom In button
Decreases the time value (in seconds) as displayed by the time axis (horizontal axis). As a result, the
display zooms in on the horizontal axis.
2. Audio Components
60 | ProVisionaire Design Component Guide