
User Manual
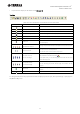
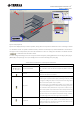
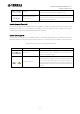
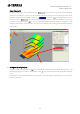
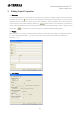

Table Of Contents
- System Requirements
- Installation
- Installing Speaker Data
- Uninstalling
- Table of Contents
- 1. Y-S3 General Operation
- 2. Constructing the Room Shape & Audience Area
- 3. Editing Project Properties
- 4. Placing Speakers
- 5. Adjusting Speaker Parameters
- 5-1. Speaker Arrays
- 5-2. Distributed Speakers
- 6. Displaying Calculation Results
- 7. Simulation Results Report
- 8. Exporting Configurations in DME Designer Format
- 9. Other Functions
- 10. General Theory

Yamaha Sound System Simulator Y-S
3
Owner’s Manual V3.1
14
Graph (Chapter 6)
The graph displays the current calculation results ( ) for a +Position on the receiving surface. Drag the
+Position cursor with your mouse to see the calculation results for a given point on the receiving surface. At the
desired receiving point, select a graph number (e.g. ), and click . The graph changes color and
the current results ( ) are saved to the selected graph number. You can save calculation results for up
to 8 points on the graph. Click to open an Information window displaying details on the graph number
selected. In this window, you can also add a dry source to the response at the receiving points calculated and listen
to the results.
• Saving and Opening Projects
In order to save the whole project, click icon on the tool bar or select [Save Project (S)] or [Save Project As… (A)]
under the [File (F)] menu. In order to open a project, click icon or select [Open Project (O)] under the [File (F)]
menu.
The maximum number of projects that can be opened at once is 10. If 10 projects are already open, you can not open
another saved project.
.