Yamaha LAN Monitor for Mac User Guide EN
Table of contents Table of contents 1. Introduction . . . . . . . . . . . . . . . . . . . . . . . . . . . . . . . . . . . . . . . . . . . . . . . . . . . . . . . . . . . . . . . . . . . . . . . . . 4 1.1. About Yamaha LAN Monitor . . . . . . . . . . . . . . . . . . . . . . . . . . . . . . . . . . . . . . . . . . . . . . . . . . . . . . . . 4 1.2. Conventions used in this guide. . . . . . . . . . . . . . . . . . . . . . . . . . . . . . . . . . . . . . . . . . . . . . . . . . . . . . 5 1.3.
Table of contents 13. Import/Export the CONFIG . . . . . . . . . . . . . . . . . . . . . . . . . . . . . . . . . . . . . . . . . . . . . . . . . . . . . . . . . . 13.1. Import the CONFIG one by one . . . . . . . . . . . . . . . . . . . . . . . . . . . . . . . . . . . . . . . . . . . . . . . . . . . 13.2. Import CONFIG on multiple units at once . . . . . . . . . . . . . . . . . . . . . . . . . . . . . . . . . . . . . . . . . . . 13.3. Export the CONFIG one by one . . . . . . . . . . . . . . . . . . . . . .
1. Introduction 1. Introduction 1.1. About Yamaha LAN Monitor The Yamaha LAN Monitor provides information on Yamaha switches, and is used to monitor and control connected devices on your computer. The main functions are as follows. • You can detect the network topology and visualize the entire network. • The port status, bandwidth, and power supply status of Yamaha switches can be viewed. • You can monitor the status of each Dante-enabled device that exists on the network.
1. Introduction 1.2. Conventions used in this guide 1.2.1. Trademarks • Dante is a trademark of Audinate. • macOS, Finder, and LaunchPad are the trademarks of Apple Inc., registered in the United States and other countries. • The company names and product names in this document are the trademarks or registered trademarks of their respective companies. 1.2.2.
1. Introduction 1.4. Software operating requirements OS macOS 10.13.x / 10.14.x / 10.15.x / 11.x / 12.x CPU Intel Core family processor, Apple M1 processor (This software runs under Rosetta 2 on Macs with an Apple M1 processor.) Storage 200 MB or more free space (not including the Dante Controller) Display Resolution: 1280 x 800 or higher Other Mouse or other pointing device Ethernet (This will not work via wireless LAN.
1. Introduction power supply while updating firmware. Interrupting the power supply may prevent the firmware update process from completing normally, possibly making the device unusable. To turn off the power supply interruption function for the Yamaha PoE switch, clear the Keepalive check box in the“Connected Devices” view. For details, refer to the description provided for the Keepalive check box in the list (❷) for the “Connected Devices” view.
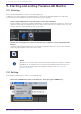
2. Installing and uninstalling Yamaha LAN Monitor 2. Installing and uninstalling Yamaha LAN Monitor 2.1. Installation Follow the steps below to install Yamaha LAN Monitor. 1. Double-click the downloaded zip file and extract it to any location. 2. Double-click “Yamaha LAN Monitor VX.X.X.pkg” (where X is the version number) in the expanded directory. The Yamaha LAN Monitor setup dialog box appears. 3. Perform the installation as directed in the screen. NOTE ◦ If the following dialog box appears, click [OK].
2. Installing and uninstalling Yamaha LAN Monitor ◦ WinPcap and Dante Discovery / Dante Control and Monitoring functions will not be uninstalled. If you want to uninstall these functions as well, make sure that other applications are not using them, and then uninstall them individually using [Uninstall] or [Uninstall or change]. 3. Restart the computer. 2.3. Installing Dante Controller Dante Controller must also be installed to launch Dante Controller from Yamaha LAN Monitor.
3. Starting and exiting Yamaha LAN Monitor 3. Starting and exiting Yamaha LAN Monitor 3.1. Starting Start Yamaha LAN Monitor in one of the following ways. A different startup sequence is used when directly starting up Yamaha LAN Monitor, and when starting it up from a snapshot file (nms file) saved on your computer. • Start Yamaha LAN Monitor from the Finder or from the LaunchPad.
3. Starting and exiting Yamaha LAN Monitor • Click the [ ] button on the top left of the window. NOTE When exiting Yamaha LAN Monitor, the window size and position, the device selected and the splitter status are stored together with the “Basic Settings” configured so that the operating environment when exiting Yamaha LAN Monitor is restored when restarting.
4. Yamaha LAN Monitor screen structure 4. Yamaha LAN Monitor screen structure The Yamaha LAN Monitor screen lists the current network status in the “Tree” view. Also, you can verify the connection status of the devices, or change some agent settings. The names of each component of the Yamaha LAN Monitor screen are described below. ❶ Menu bar ❷ Toolbar and display area ❸ Map screen ❹“Device Details” view ❺“Tree” view ❻“Connected Devices” view 4.1.
4. Yamaha LAN Monitor screen structure • Changing the height of the “Device Details” view, the “Tree” view, and the “Connected Devices” view Drag the splitter vertically (up and down) to resize.
5. Network settings on the computer 5. Network settings on the computer Configure network settings for your computer. 1. Connect the computer to a network device. 2. Open “System Preferences” of macOS. 3. Click the [Setup] menu on the menu bar → [Open IP Settings for PC]. The “Network Connections” window appears. 4. From the list of network adapters, select the wired LAN adapter that you want to use with LAN Monitor. 5. Set the IP address according to your network environment.
6. Basic operation 6. Basic operation 1. Start Yamaha LAN Monitor. 2. From the network adapter selection pull-down menu in the toolbar, select the network adapter to which the network that you want to monitor is connected. 3. Click [Setup] in the menu bar → [Basic Settings] to configure basic Yamaha LAN Monitor settings. Click [OK] to apply settings.
6. Basic operation NOTE For more details on [Basic Settings], refer to the [Basic Settings] section under the “Menu bar”. 4. Select the device you wish to monitor in the “Tree” view. 5. Click the [Snapshots] button on the toolbar to use the snapshot function, as needed. Click the [Snapshots] button to save the current network status, issues detected, and other information to Yamaha LAN Monitor as a snapshot.
7. Menu bar 7. Menu bar This section provides descriptions of each menu on the menu bar: [File], [Setup] and [Help]. ❶ [LANMonitor] menu ❷ [File] menu ❸ [Setup] menu ❹ [Help] menu 7.1. [LANMonitor] menu 7.1.1. [About LANMonitor] Displays Yamaha LAN Monitor version and copyright information. 7.2. [File] menu 7.2.1. [New] Initializes the current snapshot held by Yamaha LAN Monitor. If a snapshot is already held, a confirm initialization message appears. Click [Yes] to initialize the current snapshot. 7.
7. Menu bar 7.2.3. [Save As] Displays the “Save As” dialog box. Saves the snapshot held by Yamaha LAN Monitor to the computer or an external memory device. The saved file has a filename extension of “.nms.” 7.2.4. [Exit] Exits Yamaha LAN Monitor. 7.3. [Setup] menu 7.3.1. [Import Label Settings] Opens the “Import Label Settings” dialog box. Loads device labels displayed in the “Connected Devices” view from a file. 7.3.2. [Export Label Settings] Opens the “Export Label Settings” dialog box.
7. Menu bar ❶ Agent monitoring time interval Set the agent monitoring time interval in seconds. • Setting range: 2 – 10 sec • Default: 3 sec This will detect the agent and update the Map screen every time the set amount of seconds elapses. ❷ Monitoring times until agent disappearance is detected Set the monitoring times until agent disappearance is detected.
7. Menu bar ◦ Setting range: 1 – 1800 sec ◦ Default: 10 sec • Wait time for reply: Set the wait time for reply to pings in seconds. ◦ Setting range: 1 – 60 sec ◦ Default: 1 sec • Number of failure for detecting down: Set the number of failures before a connection is detected as being down. ◦ Setting range: 1 – 100 times ◦ Default: 3 times ❻ Power supply interruption time Suspends the power supply when a disrupted or inactive connection is detected.
7. Menu bar 7.3.4. [VLAN registration] Open the “VLAN registration” dialog box. Register the VLAN to use with the Yamaha LAN Monitor. The VLAN you register here will be used when configuring the tagged VLAN for the switch. Also, as the registered VLAN information is saved in the label settings file, you can export the file from the “Export Label Settings” in the Setup menu. ❶ List of registered VLAN Displays the list of the VLAN registered with the Yamaha LAN Monitor.
7. Menu bar ❼ [OK] button Press this to apply the setting contents. ❽ [Cancel] button Press this to close the dialog box without applying the changes you made to the settings. 7.4. [Help] menu 7.4.1. [User Guide] Access the Yamaha website and open the User Guide. 7.4.2. [Legal] Displays license information for open source software used by Yamaha LAN Monitor.
8. Toolbar and display area 8. Toolbar and display area This section describes the display area and each button on the toolbar: [Device search], [Snapshots], [Notifications], [History], [Whole map] and [Dante Controller]. ❶ Network adapter selection pull-down menu ❷ [IP Address (PC)] ❸ Screen switching button ❹ [Device search] button ❺ [Snapshots] button ❻ [Notifications] button ❼ [History] button ❽ [Whole map] button ❾ [Dante Controller] button 8.1.
8. Toolbar and display area 8.3. Screen switching button This is a toggle button to switch between the Map screen and the List screen. If the Map screen is displayed, the “Map” button will appear in black. If the List screen is displayed, the “List” button will appear in black. 8.4. [Device search] button Opens the “Device search” dialog box. This function can use specified IP addresses to ping devices that are connected to the current network.
8. Toolbar and display area ❶ Ping You can ping one or more specified IP addresses. Select a radio button to specify which type of test you want to execute. Click the [Execute] button to start a ping test. The results of the ping test appear in the Result of searching area. When you select [IP address] and execute a ping test, the Result of searching area displays the test results regardless of whether there is a reply.
8. Toolbar and display area 8.5. [Snapshots] button Saves the current network connection status to Yamaha LAN Monitor as a snapshot. Click the [Snapshots] button to display a save snapshot confirmation message. Click [OK] to save the snapshot. NOTE • The snapshot function compares the current network connection status with the previously saved snapshot and displays a message in the “Notification” area when a change is detected.
8. Toolbar and display area 8.6. [Notifications] button / “Notification” area Shows a message in the “Notification” area when there is a change in the current network and snapshot (the previously-saved network status). The message disappears when the network returns to the same state as the snapshot. NOTE • The message history is added to the “History” area. Click the [ to display the “History” area.
8. Toolbar and display area ❶ “Notification” area Messages regarding the current network are shown here. When a new message is added, the “Notification” area appears automatically. The “Notification” area can also be displayed by clicking the [ ] button. When a message is displayed, you can close the “Notification” area by clicking the [ button. ] • Date/Time : Shows the date and time at which the message was output.
8. Toolbar and display area 8.8. [Whole map] button Displays the whole map screen. This displays all of the devices connected to the network in a single view. A print function allows you to print the whole map that is being displayed. ❶ Button area • [ ] button Refreshes the information in the network configuration display area. Click this button to refresh with the latest information. • [ ] button Displays the print preview screen. You can print the whole map.
8. Toolbar and display area • Link speed Shows the link speeds. The link speed between devices (the link speed for the port of the higher device) is indicated by a colored connection line between the device icons (the lime line in the figure below). The link speed indicated by each color is described in the legend at the upper right of the screen. ❸ Network configuration display area Shows the information of agents and equipment in the network.
9. Map screen 9. Map screen ❶“Device Details” view ❷ Tree view ❸“Connected Devices” view 9.1. “Device Details” view This shows detailed information about the device that is selected in the tree view. The left side shows detailed information about the device, and the right side shows port information and information on the Dante-enabled device. The displayed contents will vary depending on the device in use.
9. Map screen ❶ Device Details This area shows the following information. Depending on the device, some items will not be shown. “Label” Shows the device label that was entered in the “Device Settings” dialog box or the “Connected Devices” view. “Model name” Shows the model name of the device. “Comment” Shows the comment that was entered in the “Connected Devices” view. You can freely enter information about the on-site cabling or the role of the device.
9. Map screen NOTE For more details on the graphic display, refer to “Port icons in the “Device Details” view”. The bandwidth usage update interval can be changed in the “Basic Settings” dialog box, under “Information update interval for selected agent” “Bandwidth”. ❸ Information for the Dante-enabled device This area shows information for the Dante-enabled device. To display information for the Dante-enabled device, Dante Control and Monitoring must be installed.
9. Map screen ❺ [Device Settings] button This shows the “Device Settings” dialog box. For details, refer to “Device Settings” dialog. ❻ [Web GUI] button (shown only for an agent device with a Web GUI) When you click this, the Web GUI of the device currently selected in the tree appears in the default browser. In the Web GUI, you can configure settings for Yamaha switch and Yamaha wireless LAN access point and manage them. For details, refer to “Logging in to the Web GUI”.
9. Map screen ❶ Sorting order reference node selection pull-down menu Selects the Yamaha switch that you want to appear at the top of the tree view. These are shown in their connection order relative to the selected Yamaha switch. NOTE • Only the Yamaha switch for the current network will appear in the sorting order reference node selection pull-down menu. • When starting Yamaha LAN Monitor, the Yamaha switch closest to the computer will serve as the starting point for the tree view.
9. Map screen “VLAN ID” Shows the VLAN ID joined by the port to which the device is connected. When multiple VLAN IDs are set, each VLAN ID will be separated with a comma. Maximum of 9 (trunk=8, access=1). The access port (A), and trunk port (T) will appear after the VLAN ID. However, (A) will not appear when only the access port is in use. “Snapshot” Specifies whether each device is included as a target of the snapshot function. Users can switch settings only for the devices other than agents.
9. Map screen [Keepalive] Select this check box to perform keepalive checks on the device. If this check box is selected, Yamaha LAN Monitor pings the device to perform keepalive checks according to settings configured in the “Basic Settings” dialog box. Selecting this check box will display the following depending on the circumstances. • Checking: Now checking. • UP: Successfully detected device. • DOWN: Failed to detect device.
9. Map screen monitoring. Subsequently, if a device saved in the snapshot is no longer found, the corresponding device is shown in red. If a device that had not been saved previously is newly found, the corresponding device is shown in blue. ❸ [Refresh] button Refreshes the information for the other agents or devices that are connected to the agent selected in the tree view.
10. List screen 10. List screen This screen displays the agents managed by Yamaha LAN Monitor as a list. ❶ List display switching button ❷ Operation panel ❸ Device list ❶ List display switching button Tab button to switch between the following three types of list views. Tab name Descriptions L2MS Agent List Displays a list of Yamaha switches and Yamaha wireless LAN access points being managed by LAN Monitor. For details, refer to “L2MS Agent List” tab.
10. List screen ❷ Operation panel This panel shows the buttons for controlling the list display, the buttons to operate on the currently selected device and a search box to narrow down the display by search term. The buttons that appear on each tab are different. For details, refer to “L2MS Agent List” tab, “Firmware Update” tab, “Config Import/Export” tab. ❸ Device list Displays a list of devices corresponding to the currently selected tab. Different devices are shown on each tab.
10. List screen NOTE Items that are hidden in the “View settings” will not be included in the exported CSV file. Also, when narrowing down the search results, devices that are not shown in the search results are not included in the exported CSV file. ❻ “Search” box Narrows down the currently displayed device by string. Type the string you want to search in the text box and press Enter key or the Search button to execute the search.
10. List screen “IP address” Shows the IPv4 address of the device. As with the “Connected Devices” view, you can use the opens the Web browser button. “Firmware revision” Shows the firmware revision of the device. “Date and time of last CONFIG import” Shows the date and time of the last CONFIG import. When you perform a CONFIG import, the information to be displayed in this area will be saved. This information will also be saved in the exported “Label Settings file”.
10. List screen 10.2. “Firmware Update” tab From this tab, you can update the firmware for devices being managed by LAN Monitor, and view information about the firmware. Only devices that support firmware update from LAN Monitor will be displayed in this screen. When you select a device and then press the “Firmware Update” button, a dialog box will appear that confirms the firmware update of all selected devices at once. For details, refer to “Update firmware on multiple units at once”.
10. List screen “Device name or Device Label” If a device label has been set, the device label will be displayed; otherwise, the device name will be displayed. “Model name” The same contents as the “L2MS Agent List” tab will be displayed. “Firmware revision” The same contents as the “L2MS Agent List” tab will be displayed. ❼ Check box Used to select or deselect a device. 10.3.
10. List screen ❺ “CONFIG export” button Displays a dialog box to confirm exporting CONFIG files of the currently selected devices in bulk. ❻ “Search” box Narrows down the currently displayed device by string. The behavior is equivalent to the “L2MS Agent List” tab. ❼ Device list Displays a list of devices that support CONFIG import/export by LAN Monitor. The items that will be displayed are as follows. Check box Used to select or deselect a device.
11. Configuring the device 11. Configuring the device With Yamaha LAN Monitor, you can configure some of the functions for Yamaha switches and Yamaha wireless LAN access points. There are the following three methods for setting the device. Setting method Descriptions “Device Settings” dialog You can set basic items such as IP address and device name. For models without a Web GUI, a detailed setting dialog will be displayed.
11. Configuring the device [Include in a snapshot] Turns the snapshot function on/off for each device. For an agent device, check box this is fixed on. This item will be displayed for all devices. “Label Settings” You can enter any label or comments you like to identify each device. Since the labels and comments you set will only be used within LAN Monitor, this information can be associated with the device without changing the settings of the device itself. This item will be displayed for all devices.
11. Configuring the device 11.1.2. For the SWX2110/SWX2110P series Yamaha switch Use this to view or change the settings. The tabs shown at the top of the dialog allow you to switch between information displays. • [Switch settings] tab: View or configure the settings of the Yamaha switch. • [Port settings] tab: Configure basic functions, VLAN, and other settings for each port. Switch settings Device name Changes the device name. Click the [Settings] button to display the “Device name” dialog box.
11. Configuring the device Frame counter reset Resets the frame counter. Click the [Execute] button to display a “Frame counter reset” confirmation message. Firmware Update Updates the firmware of the switch. Click the [Execute] button to display the “Firmware Update” dialog box. CONFIG export Export the CONFIG of the switch. Click the [Execute] button to display the “CONFIG export” dialog. CONFIG import Import the CONFIG of the switch. Click the [Execute] button to display the “CONFIG import” dialog.
11. Configuring the device 11.2. Web GUI If the Yamaha switch provide a web page for configuring settings, you can display this web page in your browser to configure basic settings and perform device management. This web page is referred to as a Web GUI. For more information on recommended browsers for viewing the Web GUI, check the URL below. http://www.rtpro.yamaha.co.jp/RT/FAQ/gui/browser_en.
12. Update the firmware 12. Update the firmware LAN Monitor allows you to update the firmware in the following two ways. • Update the firmware one by one from the “Device Settings” dialog. • From the “Firmware Update” tab on the list screen, select “Update firmware on multiple units at once”. NOTE • Since L2MS is used for firmware updates, it is easy to update the firmware even without an IP address configured.
12. Update the firmware 2. Click the “Update firmware from PC” button or the “Execute” button in the Firmware Update row. 3. Click the “Select file” button to select the firmware file. 4. After selecting the file, click the “Update” button.
12. Update the firmware 5. Wait until the progress bar reaches 100%. 6. After the reboot of the device with updated firmware is complete, check the firmware revision of the updated device. 12.2. Update firmware on multiple units at once To update the firmware on multiple units all at once, follow the steps below. NOTE Firmware update is executed in order of the devices farthest away from the LAN Monitor, so the firmware can be updated in batches while maintaining the cascade connection. 1.
12. Update the firmware 3. Check the checkboxes of the devices for which you want to update the firmware. 4. Press the “Firmware Update” button. 5. Click the “Browse” button to select the firmware file for each model. 6. After selecting the file, check the firmware revision of the file. 7. Select whether to perform a revision check after the file is sent, then press the “Execute” button.
12. Update the firmware 8. Wait until the progress bar reaches 100%. NOTE The progress bar will be at 50% when the firmware file transfer is complete, and at 100% when the updated firmware revision has been verified. 9. Check the execution results and output the results to a file if necessary. NOTE ◦ For the execution result of the firmware update, please refer to “Execution result of firmware/CONFIG bulk operation”.
13. Import/Export the CONFIG 13. Import/Export the CONFIG LAN Monitor allows you to import/export CONFIG in the following two ways. • Importing/exporting from the “Device Settings” dialog, one unit at a time • Importing/exporting from multiple units at once from the “Config Import/Export” tab on the List screen NOTE • By using the CONFIG export function, you can back up the CONFIG file of the agent device to your PC.
13. Import/Export the CONFIG 2. Click the “Import” button or the “Execute” button in the CONFIG import row. 3. Click the “Select file” button and select the file you want to import. 4. After selecting the file, click the “Execute” button. 5. When the following dialog box appears, the import of CONFIG is complete.
13. Import/Export the CONFIG 13.2. Import CONFIG on multiple units at once To import CONFIG on multiple units all at once, follow the steps below. 1. Press the “List” button to open the List screen. 2. Press the “Config Import/Export” tab. 3. Check the checkboxes of the devices for which you want to import the CONFIG. 4. Press the “Config import” button. 5. Select one of the following three methods to specify the CONFIG to be imported.
13. Import/Export the CONFIG How to specify the CONFIG to be imported Descriptions Specify the CONFIG file to be imported to each agent Selects individual CONFIG files to import. Send one CONFIG file to all Sends a single CONFIG file to all selected agents. specified agents Used to prepare multiple agents with the same settings. This item cannot be selected when multiple models are selected.
13. Import/Export the CONFIG 9. Check the execution results and output the results to a file if necessary. NOTE ◦ For the execution result of the CONFIG import, please refer to “Execution result of firmware/CONFIG bulk operation”. ◦ The execution result file is also automatically saved to the following location.
13. Import/Export the CONFIG 13.3. Export the CONFIG one by one To export the CONFIG, follow the steps below. 1. Use one of the following methods to display the “Device Settings” dialog of the device that supports CONFIG export. ◦ “Device Settings” button on the Map screen ◦ “L2MS Agent List” tab on the List screen - “Setting” button 2. Click the “Export” button or the “Execute” button in the CONFIG export row.
13. Import/Export the CONFIG 3. Click the “Execute” button and specify a file name to save the file. 4. When the following dialog box appears, the export of CONFIG is complete.
13. Import/Export the CONFIG 13.4. Export CONFIG on multiple units at once To export CONFIG on multiple units all at once, follow the steps below. 1. Press the “List” button to open the List screen. 2. Press the “Config Import/Export” tab. 3. Check the checkboxes of the devices for which you want to export the CONFIG. 4. Press the “Config export” button. 5. Press the “Browse” button and specify the folder where you want to save the exported CONFIG.
13. Import/Export the CONFIG 6. When you have finished selecting the destination folder for export, press the “Execute” button. 7. Wait until the progress bar reaches 100%. 8. Check the execution results and output the results to a file if necessary. NOTE ◦ For the execution result of the CONFIG export, please refer to “Execution result of firmware/CONFIG bulk operation”. ◦ The execution result file is also automatically saved to the following location.
14. Resources 14. Resources 14.1. Port icons in the “Device Details” view You can check the status of each port by checking the icon color and shape of each device port shown in the “Device Details” view. In the “Device Details” view, switch between the [Port Status] tab, the [Bandwidth(%)] tab and the [PoE status (Class)] tabs to show the following icons. NOTE • The [Bandwidth(%)] tab will only show Yamaha switches. • The [PoE status (Class)] tab will only show Yamaha PoE switches. 14.1.1.
14. Resources 14.1.2. [Bandwidth(%)] tab icons This area shows the bandwidth usage of each port (Yamaha switches only). Icon Meaning Bandwidth from 95% to 100% Bandwidth from 85% to less than 95% Bandwidth from 75% to less than 85% Bandwidth from 65% to less than 75% Bandwidth from 55% to less than 65% Bandwidth from 45% to less than 55% Bandwidth from 35% to less than 45% Bandwidth from 25% to less than 35% Bandwidth from 15% to less than 25% Bandwidth from 7.
14. Resources 14.1.3. [PoE status (Class)] tab icons This area shows the power supply status for each port (PoE-enabled Yamaha switches only).
14. Resources 14.2. Messages shown in both the Notification area and the History area Messages shown in both the “Notification” area and the “History” area are as follows. 14.2.1. Switch function error messages The following messages appear when an error occurs with the switch function.
14. Resources Messages [mac] label: Connected via the main route. [mac] label: The loop at the Yamaha switch was resolved. [mac] label: The power supply interruption of the Yamaha switch was resolved. [mac] label: The power supply abnormality of the Yamaha switch was resolved. [mac] label: The power supply overload of the Yamaha switch was resolved. [mac] label: The fan malfunction of the Yamaha switch was resolved. [mac] label: The level of light received at port (n) of the Yamaha switch is insufficient.
14. Resources Messages [mac] label: The power supply was forced to stop on the Yamaha switch (Stack ID: m) due to a thermal abnormality. [mac] label: The power supply was forced to stop on the Yamaha switch (Stack ID: m) because the fan stopped. [mac] label: The PoE power supply has recovered from forced stoppage of the Yamaha switch (Stack ID: m). [mac] label: The power supply was forced to stop on the Yamaha switch (Stack ID: m) because of a power supply abnormality.
14. Resources 14.2.3. Messages generated by the snapshot function The following messages appear when the snapshot function detects a network error, or when snapshot creation is started. mac indicates the MAC address of the device that is the subject of the message, label indicates the label identifying the device (does not appear when left blank), n indicates the port number. Messages are not shown for devices that are not the subject of monitoring by the snapshot function.
14. Resources 14.2.5. Other notifications Messages The snapshot file is invalid. Stopped loading snapshot file. An invalid value was included in the information of the snapshot file. Only the valid information has been applied. There are conflicting MAC addresses. The MAC address information that was listed first has been applied. The label settings file is invalid. Stopped loading label settings file. An invalid value was included in the information of the label settings file.
14. Resources 14.4. Execution result of firmware/CONFIG bulk operation The following are the execution results displayed when executing bulk firmware update and bulk CONFIG import/export. Result Descriptions Completed The firmware update and CONFIG import/export processes have been completed successfully.
15. Troubleshooting 15. Troubleshooting Symptom Cause The device is Network adapter selection is not listed in the incorrect. Map/List A wireless LAN network adapter screen is selected. Because numerous devices are connected, it is taking a long time to search for devices. Action Select the network adapter that is connected to the network that you want to monitor. Select a wired Ethernet network adapter as this software does not support wireless LAN. This may take several minutes; please wait.
15. Troubleshooting Symptom Cause Action Multiple devices are shown with the same port number By design, if multiple Danteenabled devices are connected as a daisy-chain, they are shown together at the same port number as the device that is connected immediately below the Yamaha switch. By design, devices that are — connected below a switch made by another manufacturer are shown together immediately below the Yamaha switch that is located upstream of the switch made by the other manufacturer.
15. Troubleshooting Symptom Cause The dialog “This Wi-Fi is off on macOS10.15.x or PC has no later. network interface.” is displayed and the network adapter cannot be displayed on Yamaha LAN Monitor. 76 | Yamaha LAN Monitor for Mac User Guide Action • Turn on Wi-Fi in the network settings of macOS10.15.x or later.
© 2020 Yamaha Corporation Published 01/2023 YJ-N0