
User Manual


7
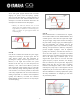
[ Fig.13 ] A typical impedance curve of a bass reflex woofer. The nominal
impedance is 4 ohms but the lowest impedance is below 4 ohms.
3.2. Comparison of amplifiers at lower
impedance situations
Below are oscilloscope measurements to visualize
differences in behaviors of some of the better known
power amplifiers available today. The test signal is sine
wave (200 cycles of 500 Hz = 0.4 sec) followed by 1.2
seconds of interval (no signal). This frequency can be
found in many typical program materials, and an interval
was set because continuous playback of sine waves is
not realistic in actual sound reinforcement applications.
This is a comparison of various power amplifiers in the
market, all of which are rated from 2500W to 3000W at
2 ohms. Voltage gain and input levels have been
carefully measured and adjusted for a fair comparison.
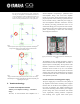
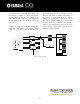
0.4sec 0.4sec1.2sec interval
500Hz x 200 cycle
sine wave
Time
Oscilloscope screenOscilloscope screen
Digital
Oscilloscope
A+
A-
B+
B-
2 ohm
Dummy load
2 ohm
Dummy load
Signal Generator
A+
A-
B+
B-
[ Fig.14 ] Set up overview
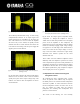
[ Fig.15 ] The input signal. The same waveform with a higher amplitude is
desired for the output signal of the amplifier.
[ Fig.16 ] Output of Yamaha’s T5n amplifier (2500W @ 2ohms). Output signal
is very true to the input signal.