
User Manual


Speaker System Design Guide for
Yamaha Sound System Simulator
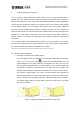
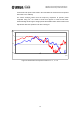
250 Hz 500 Hz
1 kHz 2 kHz
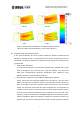
Figure 2: Sound pressure distributions for different frequency bands
(all 1/1 OCT Band; the listed frequency is the center frequency)
; Comparison with Actual Measurements
In the actual sound field, the areas of phase interference between speakers will be
affected by reflected sounds. To help explain how the effects of reflected sounds are
manifested, a comparison between the computed results and actual measured results
is given below.
¾ Measurement Conditions
In the actual measurement, two IF2115/64 speakers were installed with a splay
angle of 50 degrees. They were hung on a pole and installed 7.2 m above the
stage floor. Omnidirectional condenser microphones were installed in thirty
different locations to measure impulse response.
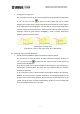
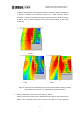
¾ Areas of Phase Interference in the Middle to High Frequency Bands
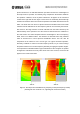
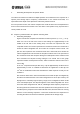
Figure 3 shows the sound pressure distributions for the 500 Hz, 1 kHz and 2 kHz
bands. The right sides of the figures show the actual measured results, and the left
sides of the figures show the computed results. Both show the 1/1 OCT Band
results. The measured results show the values integrated over 1 second after the
reception of direct sound. As discussed earlier, the YS3 computed results indicate
areas of phase interference between the two speakers in the 1 kHz and 2 kHz
frequency bands. A similar pressure distribution appears in the measured results.
Pressure distribution differences between computed and measured results vary
depending on how sound is reflected from the walls, but if the target area has been
5