
User Manual

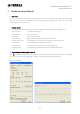
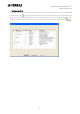
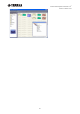
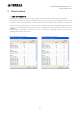
Table Of Contents
- System Requirements
- Installation
- Installing Speaker Data
- Uninstalling
- Table of Contents
- 1. Y-S3 General Operation
- 2. Constructing the Room Shape & Audience Area
- 3. Editing Project Properties
- 4. Placing Speakers
- 5. Adjusting Speaker Parameters
- 5-1. Speaker Arrays
- 5-2. Distributed Speakers
- 6. Displaying Calculation Results
- 7. Simulation Results Report
- 8. Exporting Configurations in DME Designer Format
- 9. Other Functions
- 10. General Theory

Yamaha Sound System Simulator Y-S
3
Owner’s Manual V3.1
51
• Frequency characteristics
The graph displays the current calculation results ( ) for the +Position on the receiving surface. You can
use the list box to change the bandwidth of the graph displayed. In “Array Mode” and “Single Mode”, the Graph
displays only the response of the speaker selected in Speaker List. However, the “on/off” staff of the speaker (based
on the “on/off” status of the checkbox) is also displayed. In “SPL Mode”, the graph displays combined responses of
all speakers set to on. To move a receiving point, drag the black or gray point in Aspect View. The selected receiving
point is indicated with a black plus cursor, and the coordinates are shown at the bottom right of Aspect View. A
receiving point cannot be moved across floors. Move the black or gray cursors on the receiving surface of the
applicable floor. Click the right mouse button to open an Information window with detailed information related to
the current position of the cursor.
Graph (1/6 Oct Band)
The graph displays the current calculation results ( ) for a +Position on the receiving point. Drag the
+Position cursor with your mouse to see the calculation results for a given point on the receiving surface. At the
desired receiving point, select a graph number (e.g. ), and click . The graph changes color and
the current results ( ) are saved to the selected graph number. You cannot move the plus cursors for
the receiving points that have been saved. You can save calculation results for up to 8 points on the graph. Right
clicking a graph number opens a menu from which you can change names, save and delete data, and display and
information window. Select a graph number to display the appropriate graph in Graph. You can also use the on/off
checkboxes to hide or display each graph. You can use the list boxes to select the maximum display figure and range
and change the display range of the graph.