User’s Manual Model DX1002/DX1004/DX1006/DX1012/ DX1002N/DX1004N/DX1006N/DX1012N Daqstation DX1000/DX1000N IM 04L41B01-01E 7th Edition
Thank you for purchasing the Daqstation DX1000 (hereafter referred to as “DX”). This User’s Manual explains how to use the DX. To ensure correct use, please read this manual thoroughly before operation. The following manuals are provided for the DX: • Paper Manual Manual Title DX1000 Operation Guide Manual No. IM 04L41B01-02E Control of Pollution Caused IM 04L41B01-91C by the Product Description Explains the basic operations of the DX. It is also provided in the CD-ROM.
Notes Trademarks Revisions ii • The contents of this manual are subject to change without prior notice as a result of continuing improvements to the instrument’s performance and functions. • Every effort has been made in the preparation of this manual to ensure the accuracy of its contents. However, should you have any questions or find any errors, please contact your nearest YOKOGAWA dealer.
DX’s Version and Functions Described in This Manual The contents of this manual corresponds to the DX with release number 4 and style number 3. DX’s Version and Functions For the procedure to check the version, see section 2.5. Edition DX 2 Version 1.11 Version 1.21 (Added) (Added) (Added) (Added) (Added) (Changed) (Added) (Added) (Added) (Changed) (Changed) 3 Release (Added) number (Changed) 2 (Version 2.
DX’s Version and Functions Described in This Manual Edition DX 5 Release number 3 (Version 3.0x) Style number 3 iv Addition and change to functions Divided the setting mode displays with tabs. Added method for switching from setting mode to basic setting mode. Improved numeric input operation. Added the ability to input the following characters: [ ] and :. Added new input type (GOST; /N3 option). Increased measurement range for TC Type N. Custom display. Multi Batch (/BT2 option). Alarm level display.
DX’s Version and Functions Described in This Manual Edition DX 6 Release number 4 (Version 4.0x) Style number 3 7 Addition and change to functions Advanced security function (/AS1 option). Report template (/M1 and /PM1 options). Added the “Seprt2” report file separation method. Calibration management (/CC1 option). Added functions and improvements to the custom display. The main changes are listed below. The status display section can be hidden.
How to Use This Manual Structure of the Manual Read the Operation Guide first to familiarize yourself with the basic operation, and then read this manual. For a description of the communication function and the accompanying software program, DAQSTANDARD, read the respective manual. This user’s manual consists of the following sections. Chapter 1 2 3 4 5 6 7 8 9 10 11 12 Appendix Title and Contents Overview of Functions Describes the functions of the DX.
How to Use This Manual Conventions Used in This Manual Unit K k Denotes 1024. Example: 768 KB (file size) Denotes 1000. Markings Improper handling or use can lead to injury to the user or damage to the instrument. This symbol appears on the instrument to indicate that the user must refer to the user's manual for special instructions. The same symbol appears in the corresponding place in the user's manual to identify those instructions.
Contents DX’s Version and Functions Described in This Manual.................................................................... iii How to Use This Manual................................................................................................................... vi Chapter 1 Chapter 2 Chapter 3 Overview of Functions 1.1 1.2 1.3 1.4 1.5 1.6 1.7 1.8 1.9 1.10 Common Operations 2.1 2.2 2.3 2.4 2.5 2.6 2.7 2.8 2.9 2.10 2.11 2.12 2.13 2.14 Setting the Date/Time.....................................
Contents Chapter 4 Chapter 5 4.1 4.2 4.3 4.4 4.5 4.6 4.7 4.8 4.9 4.10 Operations in Operation Mode.............................................................................................. 4-1 Displaying the Measured Data as Waveforms, Values, or Bar Graphs ............................... 4-4 Displaying Past Measured Data (Historical Trend Display).................................................. 4-9 Display the Statuses of All Channels on One Screen (Overview Display)..........................
Contents Chapter 7 Customizing Actions Using the Event Action and Remote Control Functions (/R1 and /PM1 Options) 7.1 7.2 7.3 Chapter 8 Chapter 9 Setting the Event Action Function (Including the remote control function of the /R1 and /PM1 options and the USER key).................................................................................................. 7-1 Setup Examples of Event Action...........................................................................................
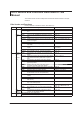
Chapter 1 1.1 Overview of Functions Input Section 1 2 • Number of Measurement Channels and Scan Interval The DX samples the input signals on the measurement channels at the scan interval to obtain the measured values. The table below shows the relationship between the number of measurement channels and the scan interval. Model No.
1.1 Input Section The following input processing and computation are available. Moving average DC Voltage Shunt resistor DC current Linear Calibration Low cut Difference Measured scaling correction computation value (/CC1 option) √ Square root computation 1-5V Burnout detection RJC Thermocouple Burnout detection RTD ON/OFF input Convert to number of pulses over 1 second Pulse (/PM1 option) Dotted lines indicate that the function can be selected.
1.1 Input Section x B X a A X = (B – A) x–a b–a +A Measured value 0V A a Number of break points: Up to 16 ) b –100 °c The measured value of the channel is set to the difference with respect to the measured value of the reference channel. Input value – Measured value 5 Result of square root computation Input value 6 For the setting procedure, see section 3.3.
1.2 Alarms This function generates an alarm when the measured data meets a certain condition. Up to four alarms can be set for each channel. Alarm Type You can use the alarms shown below. The character inside the parentheses is the symbol denoting each alarm. For the alarm setting procedure, see section 3.7.
1.2 Alarms Alarm Indication • Alarm Levels and Colors (Release number 3 or later) ou can set separate levels and colors for the four alarms on a single channel. When Y multiple alarms occur, the DX gives higher priority to the display of alarms with higher levels. It is easy to understand what processes are taking place when alarms occur if you associate an alarm’s color with its level. Level and color settings are the same for each channel.
1.2 Alarms Alarm Output Relay Operation Contact signals can be generated from alarm output relays (/A_ option) when alarms occur. The alarm output relay operation can be changed. For the setting procedure, see section 3.5.
1.2 Alarms • Energize or De-energize Operation • Non-Hold/Hold The alarm output relay can be set to operate in the following fashion when the alarm condition is no longer met. • Turn OFF the relay output (non-hold). • Hold the relay at ON until the alarm ACK operation is executed (hold). The setting applies to all alarm output relays. • Alarm ACK Operation The alarm acknowledge (alarm ACK) operation releases all alarm indications and relay outputs.
1.2 Alarms Alarm Annunciator Function (Release number 3 or later) You can use the DX as an alarm annunciator. No lock-in, lock-in, and double lock-in sequences are supported. The alarm display and alarm output relay operations follow the annunciator sequence. For the setting procedure, see section 3.12.
1.3 Display 1 2 • 5.5-inch TFT Color LCD and the Screen Configuration The DX has a 5.5-inch TFT color LCD (240 × 320 dot resolution). The screen consists of the status display section and the data display section.
1.3 Display Status Display Section The following information is displayed in the status display section during operation mode or setting mode. Memory sampling status Data type DISP: Display data EVENT: Event data Memory sampling progress Memory sampling Displays the progress using a green bar graph. The frame indicates the file save interval (display data) or the data length (event data). in progress Error in internal memory. Contact your nearest YOKOGAWA dealer for repairs.
1.3 Display Trend Display (T-Y) Measured data is displayed in a waveform. For the operating procedure, see section 4.2. Overview of Functions Current value mark 2 Scale See section 5.7 Trend interval See section 5.3 Grid See section 5.10 Trip line (up to four lines) See section 5.1 Trend Space function Inserts a division-wide space here. See section 4.2 1 division (30 dots) 3 Numeric display section See section 4.2 Time at the grid position Either displays the time, or the date and time.
1.3 Display • Updating of the Waveform On the screen, 30 dots along the time axis is represented by a unit called division (see the figure on the previous page). The displayed waveform is updated at an interval corresponding to one dot. This interval is determined by the time corresponding to one division (referred to as the trend interval).
1.3 Display 1 Message display method Overview of Functions • Except for the vertical display, you can set the direction in which messages are displayed to horizontal or vertical. For the setting procedure, see section 5.10. • Messages can be displayed consolidated at the upper left of the screen (list display). For the operating procedure, see section 4.2. 2 List display 3 Vertical display 4 • Zone Display You can display channels in specified zones.
1.3 Display • Partial Expanded Display By compressing a section of the waveform display range, the rest of the section is expanded. In the example below, 0 V (boundary value) is moved to the 30% position of the display range (new boundary position). The 30% area below the boundary corresponds to “– 6 V to 0 V” and 70% area above the boundary corresponds to “0 V to 6 V.
1.3 Display Digital Display 1 Overview of Functions Displays the measured data numerically using large numbers. For the operating procedure, see section 4.2. 2 Measured value Unit Alarm mark 3 Tag or channel number 4 Note • Numeric display of measurement channels If a measured value of a measurement channel is over range (see below), the measured value is indicated as “+Over” or “–Over.
1.3 Display Bar Graph Display Waveform data is displayed in a bar graph. For the operating procedure, see section 4.2. Vertical Bar graph base position is set to Center. Tag or channel number Alarm mark Upper limit Scale marks See section 5.7 Alarm point mark Bar (displayed with the set channel color) See section 5.11 Unit of measurement and lower limit Measured value See section 5.11 Horizontal See section 5.10 Bar graph base position is set to Normal, Lower, or Upper.
1.3 Display Historical Trend Display • Methods of Displaying the Historical Trend There are four methods to display the historical trend of the measured data in the internal memory. • Display from the alarm summary. For the operating procedure, see section 4.6. • Display from the message summary. For the operating procedure, see section 4.7. • Display from the memory summary. For the operating procedure, see section 4.8. • Recall from the display selection menu.
1.3 Display • Auto Span Display (Release number 3 or later) * The DX can automatically adjust the display span of the selected channel. It sets the span based on the maximum and minimum displayed historical data values. This setting is deactivated when you switch to another group. * Auto span affects channels that are in the same scale position as the selected channel.
1.3 Display Overview Display Channels on which an alarm is occurring are indicated in red Alarm type 1 Overview of Functions Displays a list of the statuses of all channels. You can move the cursor to select a channel and display the trend, digital, or bar graph of the group containing the selected channel. For the operating procedure, see section 4.4.
1.3 Display Alarm Summary Displays a list of the most recent alarms. • Up to 1000 alarms can be displayed. • You can select arbitrary alarm information and recall the historical trend of the display data or event data that contains the alarm information. For the setting procedure, see section 4.6.
1.3 Display Message Summary To the historical trend display 1 Overview of Functions Displays a list of written messages and the time the messages were written. • Up to 450 messages can be displayed. • Up to 50 messages that are added to the past data section (added messages) can be displayed. • You can select arbitrary message information and recall the historical trend of the display data or event data that contains the message. For the setting procedure, see section 4.7.
1.3 Display Memory Summary Displays the information pertaining to the display data and event data in the internal memory. • By selecting the display data or event data, the historical trend display can be recalled. • The number of manual sampled data and report data (/M1 and /PM1 options) in the internal memory is displayed. For the operating procedure, see section 4.8. • You can display file information (only on DXs with the /AS1 advanced security option).
1.3 Display 1 Report Data (/M1 and /PM1 Options) Overview of Functions Report data residing in the internal memory can be displayed. For the operating procedure, see section 4.5. 2 Report type Start: Start date/time Timeup: Report date/time Unit Report data status Indicates that the following occurred between the report interval.
1.3 Display Status Display The following displays are available. For the operating procedure, see section 4.5. • Relay Status Display Displays the status of the alarm output relay and internal switch. • Modbus Client Status Display and Modbus Master Status Display Displays the command status. • Event Level Switch Status (Release number 3 or later) Displays the status of the event level switches. Log Display Displays various logs (operation log). For the operating procedure, see section 4.9.
1.3 Display 1 Setting the Display Conditions of the LCD The display conditions of the LCD can be configured. Setting Background color of the operation display The background color of the display can be set to white or black. The default value is White. For the setting procedure, see section 5.12. Background color of the historical trend screen You can select white, cream, black, or light gray for the background color of the screen. The default value is Black. For the setting procedure, see section 5.
1.4 Data Storage Function This section explains the types of data that the DX can record and how to store them. For information about the data storage function on DXs with the /AS1 advanced security option, see the Advanced Security Function (/AS1) User’s Manual, IM04L41B01-05EN. Data Types The types of data that the DX can record are as follows: Data Type Display data Description • Waveform data displayed on the trend display. The measured data is recorded as a specified sampling interval.
1.4 Data Storage Function Flow of Data Recording and Storage Measurement channel Computation channel 2 Data of another device (via communication) . . . . . . 1 Overview of Functions Measured data is recorded once to the internal memory and then saved to the external storage medium.
1.4 Data Storage Function Recording Method of Display Data and Event Data For the setting procedure, see section 6.1. • Types of Data to Be Acquired Select display data only, display data and event data, or event data only. Deciding the Data to Be Recorded Record the data that suits your application. Refer to the following examples. Example 1: Continuously record the waveform data as with the conventional chart recorder. Record the display data.
1.4 Data Storage Function • Recording Conditions of Event Data File creation Description Same as the display data. Select from the available settings between 25 ms to 30 min. However, you cannot specify an interval that is faster than the scan interval. A file is created when the specified data length is reached. Files are also created in the following cases. • When a file is created manually. • When the memory sampling is stopped. • When file creation is executed with the event action function.
1.4 Data Storage Function • Creating Files through Key Operation Files can be created using keys. Key operation Time File File File Previous files Current file For operating instructions, see “Saving the Display Data or Event Data during Memory Sampling through Key Operation” in section 6.4. Manual Sampled Data Manual sampled data is recorded to the internal memory. When the number of manual sampled data exceeds 400, the data is overwritten from the oldest data.
1.4 Data Storage Function 1 Saving Data to the External Storage Medium For the setting and operating procedure, see sections 6.2 and 6.4 respectively. • CF card (32 MB or more) • USB flash memory (/USB1 option) 2 • Auto Save Have the CF card inserted in the slot at all times. The data in the internal memory is automatically saved to the CF card. Data Type Display data Auto Save Timing Description The file is saved when the file is created.
1.4 Data Storage Function Save Operation (Constantly Retaining the Most Recent Data Files Using Media FIFO) (Release Number 2 or Later) When saving the data files automatically, you can save the data so that the most recent data files are constantly retained in the CF card. This method allow you to use the DX continuously without having to replace the CF card.
1.4 Data Storage Function 1 • File Name You can select the file name configuration from three types. Overview of Functions Structure Date Description Display data Event data Manual sampled data Snapshot data Report data 7-digit 2 . Extension Date Specified string Ex.: 000123_AAAAAAAAAAA050928_174633.DAD 7-digit Type . Extension Date Specified string 3 Ex.: 000123_AAAAAAAAAAA050928_174633HD.DAR Serial Display data Event data Manual sampled data Snapshot data Report data 7-digit .
1.4 Data Storage Function File Names on DXs before Release Number 2 The table below shows the file name that is assigned when the measured data is saved to the CF card. Structure Date Description Display data Event data Manual sampled data Snapshot data Report data 7-digit Specified string Date ID . Extension Ex.: 000123_AAAAAAAAAAA050928_1746330.DAD 7-digit Type Date Specified string ID . Extension Ex.: 000123_AAAAAAAAAAA050928_174633DH0.
1.4 Data Storage Function • Saving Data through Key Operation Data Storage Description All save Collectively saves all the data in the internal memory. Selective save Saves the specified display data or event data file. Manual sampled data save Collectively saves all the manual sampled data in the internal memory. Report data save Collectively saves all the report data in the internal memory.
1.5 Batch Function This section explains the DX batch function. For information about the multi batch function (/BT2 option), see the Multi Batch (/BT2) User’s Manual, IM04L41B01-03E. Overview Batch Information You can add batch information to the display data and event data files. The files can be managed using the batch information. For the setting and operating procedure, see section 6.3.
1.6 Event Action and Remote Control Functions (/R1 and /PM1 Options) 1 Events • Events Overview of Functions A specified action is carried out when an event occurs. This function is called event action. The remote control function (/R1 and /PM1 options) allows you to specify actions to be performed when the terminal receives a contact input or an open collector signal. The remote control function is configured using the event action function. For the setting procedure, see section 7.1.
1.6 Event Action and Remote Control Functions (/R1 and /PM1 Options) • Timers Four timers are available. The timers are also used with the TLOG computation function (/M1 and /PM1 options). Timer Type Absolute timer Relative timer Set the timer A Timeout Ref. time A A Time A Set the timer Reset the timer B A: Interval Time B B: Interval • Absolute Time Mode The timer expires at the times determined by the reference time and the interval. The reference time is set on the hour (00 to 23).
1.6 Event Action and Remote Control Functions (/R1 and /PM1 Options) Action 1 Select from the following actions. Action Memory start/stop Memory start Memory stop *4 Event trigger *1 Level/Edge Level Edge Edge Edge Description Starts/stops memory sampling. Starts the memory sampling. Stops the memory sampling. Applies a trigger for starting the event data recording. This is valid when recording event data in trigger mode. See the next page. Alarm acknowledge Edge Releases the alarm output.
1.6 Event Action and Remote Control Functions (/R1 and /PM1 Options) Resetting the Relative Timer If the event is set to output relay, internal switch, match time timer, or alarm, the resetting of the timer is not considered a timeout. (The action is not executed even if the timer is used as an event.) Loading the Setup Can be specified as an action only when the event is set to remote control input. Loads the setup data file, LOAD1.PDL, LOAD2.PDL, or LOAD3.
1.6 Event Action and Remote Control Functions (/R1 and /PM1 Options) Miscellaneous 1 The combinations that are checked in the table below can be used.
1.7 Security Function This section explains the DX security functions. For information about the security functions on DXs with the /AS1 advanced security option, see the Advanced Security Function (/AS1) User’s Manual, IM04L41B01-05EN. Key Lock Function Key lock is a function that prohibits key operations. You enter a password to release the key lock. For the setting procedure, see section 8.1. Key Lock Items Description Keys The following keys can be locked independently.
1.7 Security Function Login Function • Login and Logout You enter your user name and password to log into the DX in the following cases. Method of Accessing the DX Login Required Keys • When the power is turned ON • When logging in after exiting the basic setting mode • When logging in after logging out Communication When accessing the setting/measurement server, FTP server, maintenance/test server, or Web server. 1 Overview of Functions Only registered users can operate the DX.
1.8 Computation and Report Function (/M1 and /PM1 Options) Computation Function Equations can be defined in computation channels by using the measured data or computed data as variables. The result of the computation can be displayed or stored. For the setting procedure, see section 9.1.
1.8 Computation and Report Function (/M1 and /PM1 Options) Type Example 1 Description of the Example 2 CLOG.MAX(001.002.003) Determines the maximum value among [001], [002], and [003]. CLOG.MIN(001.002.003) Determines the minimum value among [001], [002], and [003]. CLOG.AVE(001.002.003) Determines the average value of [001], [002], and [003]. CLOG.P-P(001.002.003) Determines the difference between the maximum value and the minimum value among [001], [002], and [003].
1.8 Computation and Report Function (/M1 and /PM1 Options) • Data That Can Be Used in Equations The data listed below can be used. Data Measurement channel data *1 Computation Channel data Constant Communication input data Status of the remote control *1 input *1 Pulse input Internal switch status *1 Alarm output relay status *1 Notation 001, etc. 101, etc.
1.8 Computation and Report Function (/M1 and /PM1 Options) • Computation Data Dropout • Numeric Display and Recording The range of displayed values of computed data is from –9999999 to 99999999 excluding the decimal point. The decimal place corresponds to the decimal place of the lower limit span of the computation channel. On the numeric display, values are displayed if the computed result is within the above range regardless of the upper and lower limits of span.
1.8 Computation and Report Function (/M1 and /PM1 Options) Resetting the TLOG Computed Value You can select whether to reset the TLOG computed value at each interval. The figure below illustrates the reset operation for sum computation (TLOG.SUM). Example: Result of the TLOG.SUM computation Timer timeout Reset: On 1 2 3 Reset Reset Reset Reset: Off When reset is On, the sum value is calculated over each interval. When set to Off, the sum value from computation start is calculated.
1.8 Computation and Report Function (/M1 and /PM1 Options) Report Function 1 This function is used to create hourly, daily, weekly, and monthly reports. You can select from four types among maximum value, minimum value, average value, sum value, and instantaneous value. Overview of Functions • Report Data Types 2 • Report Type Type Description Hourly report Creates report data every hour on the hour for the previous one hour.
1.8 Computation and Report Function (/M1 and /PM1 Options) Special Data Handling This section explains the handling of special data in TLOG computation, CLOG computation, and reports. • Power Failure Operation (TLOG and Reports) If a power failure occurs when the report function is enabled or in the middle of the TLOG computation, the report operation and TLOG computation resume when the DX recovers from the power failure.
1.8 Computation and Report Function (/M1 and /PM1 Options) Report Template (Release numbers 4 and later) Report file based on the template Report template file Save Internal memory 1 Overview of Functions You can create report templates and use them to automatically create custom report files. Use Microsoft Office Excel (hereinafter referred to as “Excel”) to create report template files. Load a report template file that you have created into the DX internal memory.
1.9 FAIL/Status Output Function (/F1 Option) Output Relay Operation Assignment (Release numbers 4 and later) For this function, there are relays labeled “FAIL” and “Status” on the rear panel. You can assign the operations explained below to these two relays. On a relay that has been set to “Status relay,” you must also set the DX status that will be relayed. FAIL Output When a failure occurs in the CPU of the DX, a relay contact signal (1 signal) is output.
1.9 FAIL/Status Output Function (/F1 and /F2 Options) Status Output Status Status of the internal memory or CF card Measurement error Communication error Description Error in the internal memory. Corrective Action Contact your nearest YOKOGAWA dealer for repairs. When the auto save function to the CF card is On. • The free space on the CF card dropped Replace the CF card. to 10% of the total size (only when the media FIFO (see section 1.4) is disabled). • Error in the CF card.
1.10 Other Functions Time Related Functions • Time Correction The DX internal clock can be changed in the following manner. Method Description Key operation Sets the DX internal clock to the specified time. Event action function Synchronizes the DX internal clock to the nearest hour. SNTP client function Sets the DX internal clock to the time retrieved from an SNTP server.
1.10 Other Functions System Display The displayed language can be set to English, Japanese, German, French, or, Chinese. For the setting procedure, see section 2.6. 24 VDC Power Supply for Transmitter (/TPS2 or /TPS4 Option) Provides 24-VDC power supply to up to two (/TPS2) or four (/TPS4) two-wire system transmitters. The measured values of the transmitter correspond to a current signal of 4 to 20 mA on the same cable. Therefore, the signal can be connected to the DX input terminal and displayed.
1.10 Other Functions USB Interface (/USB1 option) You can connect keyboards, barcode readers, or USB flash memory to two USB ports, one on the front and one on the back of the DX. • You can operate the DX using a keyboard or barcode reader. • You can save measured data and setup data to the USB flash memory and also load from it. For the operating procedure, see sections 2.11 and 2.12. Temperature Unit You can set the unit when measuring temperature with the thermocouple or RTD to °C or °F.
Chapter 2 2.1 Common Operations Setting the Date/Time 1 Set the date/time. If you are using the DX in a region that uses DST, specify the date/time for switching between DST and standard time. Common Operations Setup Screen 2 • Date/Time 3 Press MENU (to switch to setting mode), and select the Menu tab > Date/Time > Time Settings. 4 5 6 • DST Press MENU (to switch to setting mode), and select the Menu tab > Date/Time > Daylight Saving Time.
2.2 Setting the Time Difference from GMT Set the time zone of the region in which the DX will be used. Make sure to set this value if you are using the Internet network functions or the DST function. Setup Screen Press MENU (to switch to setting mode), hold down FUNC for 3 s (to switch to basic setting mode), and select the Menu tab > Time Settings. Setup Items • Time settings > Time zone(HHMM) Set the time zone of the region in which the DX will be used in terms of the time difference from GMT.
2.3 Setting the Time Correction Operation during Memory Sampling 1 This function gradually corrects the time when the time is changed while Memory Sampling is in progress. For a description of the time correction operation, see section 1.10. 2 Press MENU (to switch to setting mode), hold down FUNC for 3 s (to switch to basic setting mode), and select the Menu tab > Time Settings.
2.4 Setting the Date Format Select the display format of the date. Setup Screen Press MENU (to switch to setting mode), hold down FUNC for 3 s (to switch to basic setting mode), and select the Menu tab > Time Settings. Setup Items • Time settings > Date format Settings Y/M/D M/D/Y D/M/Y D.M.Y * Display Example Dates other than the grid time of Time at the grid position in the the trend display trend display (example: 8 O’clock on Nov.
2.5 Viewing the DX Information 1 Show the DX information on the system information screen and the network information screen. Common Operations Procedure 2 • Displaying System Information Screen 3 1. In the operation mode, press FUNC. The FUNC key menu appears. 2. Press the System info soft key. The system information screen is displayed. 4 • Displaying Network Information Screen 1. In the operation mode, press FUNC. The FUNC key menu appears. 5 2. Press the Network info soft key.
2.5 Viewing the DX Information • Network Information Screen There are two pages of network information. Use the left and right arrow keys to switch the screen. The following items are displayed: • IP address • Subnet mask IP address • Default gateway IP address • MAC address • DNS server IP address • Host name • Domain name • The server function setting conditions listed below.
2.6 Changing the Displayed Language 1 Set the displayed language. 2 Setup Screen Common Operations Press MENU (to switch to setting mode), hold down FUNC for 3 s (to switch to basic setting mode), and select the Environment tab > Operating Environment. 3 4 5 Setup Items 6 • Operating environment > Language Set the displayed language to English, Japanese, German, French, or Chinese.
2.7 Setting the LCD Brightness and Backlight Saver Change the LCD brightness. In addition, set the backlight saver function to prolong the service life of the LCD backlight. Setup Screen Press MENU (to switch to setting mode), and select the Menu tab > Display > LCD. Setup Items • LCD > Brightness Select a value from 1 to 8 (2 by default). Larger the value, brighter the display becomes. • LCD > Backlight saver > Mode Settings Description Off Disables the backlight saver.
2.8 Initializing Settings and Clearing the Internal Memory 1 Initialize the settings to default values. In addition, clear the data in the internal memory. For the default settings, see the DX1000/DX1000N Operation Guide (IM04L41B01-02E). Press MENU (to switch to setting mode), hold down FUNC for 3 s (to switch to basic setting mode), and select the File/Initialize tab > Initialize.
2.8 Initializing Settings and Clearing the Internal Memory Setup Items • Initialize On DXs without the /AS1 advanced security option Settings Clear 1 Clear 2 Clear 3 Description Clears and initializes the data in the internal memory in the manner indicated on the screen.
2.9 Outputting the DX Status via the Relay Contact (/F1 Option) Setup Screen 2 Common Operations A signal is output to a dedicated relay when an error occurs in the DX CPU. In addition, a signal is output to a different relay when the a specified status occurs. For a description of the FAIL/status output function, see section 1.7.
2.9 Outputting the DX Status via the Relay Contact (/F1 and /F2 Options) • Status Relay Details Press MENU (to switch to setting mode), hold down FUNC for 3 s (to switch to basic setting mode), and select the Menu tab > Status Relay > Status Relay Details. Setup Items • Relay Action > Fail Relay, Status Relay (Release numbers 4 and later) On DXs without the /AS1 advanced security option Setting Fail Status relay Description Outputs a fail relay. Outputs a status relay.
2.9 Outputting the DX Status via the Relay Contact (/F1 and /F2 Options) 1 Procedure • FAIL Output There are no operations that are required. A signal is output to the relay contact when a CPU error is detected. A signal is also output to the relay contact when the DX is turned OFF. 2 Common Operations • Status Relay A signal is output to the relay contact when a specified status occurs.
2.10 Controlling the DX with the Remote Control Terminal (/KB1 and /KB2 Options) Handling Precautions • If the infrared signal output section of the remote control terminal or the light-receiving section on the DX becomes dirty or receives scratches, it can hinder the transmission/ reception of the infrared signal. Clean the infrared signal output section of the remote control terminal or the light-receiving section on the DX. • When cleaning, wipe using a dry soft cloth.
2.10 Controlling the DX with the Remote Control Terminal (/KB1 and /KB2 Options) 1 Preparing the Remote Control Terminal • Names of Parts Keys Battery cover 2 Common Operations Infrared signal output section 3 • Loading Batteries 1. While pressing the projection on the battery cover, open the cover. Positive polarity 4 Positive polarity 2. Load the batteries. 5 3. Close the battery cover.
2.10 Controlling the DX with the Remote Control Terminal (/KB1 and /KB2 Options) Controlling the DX Control the DX by pointing the infrared output section of the remote control terminal to the light-receiving section on the DX. Control the DX while checking the results on the DX screen. Note • • • • The remote control terminal cannot be used to control the Favorite key. When a specific key operation is possible on the DX, the corresponding key on the remote control terminal is activated.
2.10 Controlling the DX with the Remote Control Terminal (/KB1 and /KB2 Options) • Entering Strings When a character input window is displayed on the DX screen, pressing the A/a/1 key switches the character type assigned to the character input keys as shown in the following figure.
2.10 Controlling the DX with the Remote Control Terminal (/KB1 and /KB2 Options) Troubleshooting The DX does not react when you try to control it using the remote control terminal. • Are the correct batteries loaded in the remote control terminal? Check the voltage and polarity of the batteries. • Are the batteries flat? Replace the batteries with new ones.
2.11 Controlling the DX with a Keyboard or Barcode Reader (/USB1 option) This section explains how to connect and use a USB keyboard or barcode reader. Barcode readers can be used if the DX release number is 3 or later. 2 • Connection 1. Connect the keyboard or barcode reader to a DX USB port. A display appears asking whether you have connected a keyboard or a barcode reader.
2.11 Controlling the DX with a Keyboard or Barcode Reader (/USB1 option) Operating from the Keyboard Use the keyboard while watching the DX screen. An operation that can be carried out on the DX can be carried out from the keyboard. Example: Switch to setting mode When the DX is in the operation mode, press Ctrl+M. The DX switches to setting mode, and the setting menu appears.
2.11 Controlling the DX with a Keyboard or Barcode Reader (/USB1 option) 1 • Invalid Keys Keys enclosed in frames are invalid.
2.11 Controlling the DX with a Keyboard or Barcode Reader (/USB1 option) Barcode Reader Operations (Release number 3 or later) When you scan communication commands with a barcode reader, the DX will respond as follows. • The DX will accumulate key codes until it reaches a terminator. Then it will execute the accumulated character string. The terminator is the enter key code. • The DX can accumulate up to 200 characters, not including the terminator.
2.11 Controlling the DX with a Keyboard or Barcode Reader (/USB1 option) • How to Use 1 Commands 2 Follow the standard operating procedure for the barcode reader that you are using. Operate the barcode reader while checking the status of the DX. An operation can be carried out using the barcode reader when it can be carried out on the DX.
2.12 Using the USB Flash Memory (/USB1 Option) Connecting/Removing a USB Flash Memory • Connecting a USB Flash Memory If you are using the multi batch function (/BT2 option), see the DX1000/DX1000N/ DX2000 Multi Batch (/BT2) User’s Manual, IM04L41B01-03E. 1. Connect a USB flash memory to the USB port on the DX. 2. In operation mode, possible operations are shown. Select the desired operation using the arrow keys and press DISP/ENTER.
2.12 Using the USB Flash Memory (/USB1 Option) 1 Saving and Loading Data The following data save/load and file operations can be carried out. Save/Load setup data files (see section 6.9). Save display data and event data files (see sections 4.8 and 6.4). Load display data and event data files (see section 6.8). List files and delete files (see section 6.7). Format (see section 6.7).
2.13 Setting the Decimal Point Type (Release number 3 or later) You can set the decimal point type for the display and files saved in text format. Setup Screen Press MENU (to switch to setting mode), hold down FUNC for 3 s (to switch to basic setting mode), and select the Environment tab > Operating Environment. Setup Items • Decimal Point Types Setting Point Comma Display Example 1234.
2.14 Showing or Hiding the Menu Item for Switching from Setting Mode to Basic Setting Mode (Release number 3 or later) 2 Common Operations Set whether or not to display a menu item in the setting mode menu for switching to basic setting mode. 1 Setup Screen 3 Press MENU (to switch to setting mode), hold down FUNC for 3 s (to switch to basic setting mode), and select the Environment tab > Operating Environment.
Chapter 3 3.1 Measurement Channels and Alarms Setting the Scan Interval and the Integration Time of the A/D Converter 1 Select the scan interval and the integration time of the A/D converter. For a description of the scan interval and the integration time of the A/D converter, see section 1.1. Setup Screen Press MENU (to switch to setting mode), hold down FUNC for 3 s (to switch to basic setting mode), and select the Menu tab > A/D, Memory.
3.2 Setting the Burnout Detection and the Reference Junction Compensation of the Thermocouple Input Set the function that detects burnouts in the sensor for thermocouple input and 1-5V input and the reference junction compensation method of the thermocouple. Setup Screen Press MENU (to switch to setting mode), hold down FUNC for 3 s (to switch to basic setting mode), and select the Menu tab > Burnout, RJC. Setup Items • First-CH, Last-CH Select the target channels.
3.3 Setting the Input Range 1 Set the input range for each channel. 2 Setup Screen • Temperature Unit Press MENU (to switch to setting mode), hold down FUNC for 3 s (to switch to basic setting mode), and select the Environment tab > Operating Environment. 3 Measurement Channels and Alarms 4 5 • Input Range for Each Channel Press MENU (to switch to setting mode), and select the Menu tab > Meas channel > Range, Alarm. 6 7 8 9 Setup Items • Temperature 10 Select the temperature unit.
3.3 Setting the Input Range • First-CH, Last-CH Select the target channels. • Range > Mode Settings Description Skip Not measured. Volt, TC, RTD, DI, 1-5V Input type. Represents DC voltage, thermocouple, RTD, ON/OFF input, and 1-5V inputs, respectively. Delta, Scale, Sqrt Difference computation, linear scaling, and square root computation. Set the items with check marks in the table below according to the mode value.
3.3 Setting the Input Range 1 • Range > Span_L, Span_U Input range. The selectable range is displayed on the screen. Note • • You cannot set the same value to Span Lower and Span Upper. When the Mode is 1-5V or Sqrt, Span Lower must be less than Span Upper. 2 • Range > Scale_L, Scale_U Note • • • The DX converts the measured value to a value obtained by removing the decimal point from the value span specified by Scale Lower and Scale Upper.
3.4 Setting the Moving Average of the Input Set the moving average function of the measurement channel. This function suppresses the effects of noise. For a description of the function, see section 1.1. Setup Screen Press MENU (to switch to setting mode), and select the Menu tab > Meas channel > Moving average. Setup Items Scan Interval Average value Average value Count • First-CH, Last-CH Select the target channels. • Moving average > On/Off To use moving average, select On.
3.5 Setting the Auxiliary Alarm Function 1 Setup Screen Press MENU (to switch to setting mode), hold down FUNC for 3 s (to switch to basic setting mode), and select the Menu tab > Alarm > Basic settings; Switch, Relay; or Hysteresis. • Basic settings • Switch, Relay 2 3 Measurement Channels and Alarms 4 5 • Hystersis 6 7 8 Setup Items • Basic settings > Reflash To set the reflash operation on the alarm output relay, select On.
3.5 Setting the Auxiliary Alarm Function • Basic setting > Indicator You can choose to make the alarm displays behave in the following ways. When you use the alarm annunciator function (release number 3 or later), the setting follows the annunciator sequence. Settings Description Nonhold Clears the alarm indication when the alarm condition is released (returns to normal condition). Hold Holds the alarm indication until an alarm acknowledge operation is performed.
3.5 Setting the Auxiliary Alarm Function • Relay > Relay Action on Ack You can select the relay output status that is enabled after the AlarmACK operation from the following two settings. When you use the alarm annunciator function (release number 3 or later), the setting follows the annunciator sequence. Settings Normal Reset An example of the relay action when alarm ACK is executed is shown below. This example is for the case when the output relay AND item is set to None.
3.6 Hiding the Alarm Indication Select whether to enable the alarm hide function. Setup Screen Press MENU (to switch to setting mode), hold down FUNC for 3 s (to switch to basic setting mode), and select the Environment tab > Alarm > Action. Setup Items • Alarm action > No logging To enable the function that turns off the alarm indicator and logging, select On. The Detect setup item is displayed in the alarm setting screen (see section 3.7).
3.7 Setting Alarms on Channels 1 Setup Screen 2 3 Measurement Channels and Alarms Set the alarms after setting the range. All alarm settings of a channel are cancelled in the following cases. • When the input type (Volt, TC, etc.) is changed. • When the input range is changed. • When the upper or lower limit of the span or scale is changed on channels that are set to linear scale, square root computation, or 1-5 V (including changes in the decimal point position).
3.7 Setting Alarms on Channels • Alarm Levels and Colors (Release number 3 or later) Press MENU (to switch to setting mode), hold down FUNC for 3 s (to switch to basic setting mode), and select the Environment tab > Alarm > Alarm level/color.
3.7 Setting Alarms on Channels 1 Setup Items • First-CH, Last-CH Select the target channels. The target channels are common with the other items that are displayed on the screen. • Alarm > 1, 2, 3, and 4 2 For each alarm, 1 to 4, select On to enable it. 3 • Alarm > Type Select the alarm type. Description H High limit alarm – L Low limit alarm – h Difference high limit alarm Can be specified on channels set to difference computation.
3.7 Setting Alarms on Channels • Alarm > Relay Select whether to turn On or Off the relay output. • Alarm > No. Set the output relay number or internal switch number when performing relay output. • Alarm > Detect This item appears when the alarm hide function (see section 3.6) is turned On. Select whether to show or hide the alarm indication when an alarm occurs. If set to Off, a signal is output to the alarm output relay or internal switch when an alarm occurs, but it is not indicated on the screen.
3.8 Releasing the Alarm Output (Alarm ACK Operation) 1 2 This operation is valid when the DX is set as follows: DX with release number 3 or later • When Annunciator mode is set to On in the basic setting mode. • When Annunciator mode is set to Off, the operation is the same as described for DX with release number 2 below. DX before release number 2 • When Indicator is set to Hold in the basic setting mode. • When Relay Hold is set to Hold in the basic setting mode.
3.9 Performing Calibration Correction (/CC1 Option) The input value is corrected using segments, and the result is used as a measured value. For a description of the function, see section 1.1. Setup Screen Press MENU (to switch to setting mode), and select the Menu tab > Meas channel > Calibration correction.
3.10 Counting Pulses (/PM1 Option) 1 The pulses applied to the pulse input terminal are counted on a computation channel. For a description of the function, see section 1.1. 2 Setup Screen Press MENU (to switch to setting mode), and select the Menu tab > Math channel > Expression, Alarm 3 Measurement Channels and Alarms 4 5 6 Setup Items • First-CH, Last-CH Select the target computation channels. 7 • Math Select On. • Math > Calculation expression 8 Enter the equation using symbols.
3.10 Counting Pulses (/PM1 Option) • Example 2: Number of Pulses per Minute Count the pulse signal applied to pulse input terminal number 6 on the DX1002 (scan interval set to 250 ms), and calculate and display the number of pulses per minute. (Moving average over a minute) Pulse input Time Sampling interval (250 ms) 101ch Number of pulses per second (60x) 102ch Number of pulses per minute Expression Assign the computation channel as shown below and set the expressions.
3.10 Counting Pulses (/PM1 Option) Pulse input Time Scan interval 2 P01 Number of pulses per scan interval 0 101ch Reset count 0 1 1 1 2 2 3 (Sum) 102ch Sum value Measurement Channels and Alarms K01 reset value 1 4 (Resets the value below the reset value) 5 Channel 101: Reset Count Calculates the number of times the pulse sum value is reset. The expression “((102+P01).GE.
3.11 Setting the Method of Detecting Over-Range Values of Linearly Scaled Measurement Channels Setup Screen Press MENU (to switch to setting mode), hold down FUNC for 3 s (to switch to basic setting mode), and select the Environment tab > Input, Tag. Setup Items • Input > Value on over-range Settings Description Free The value is set to –over range if the value is less than –30000 and +over range if the value is greater than 30000 excluding the decimal point.
3.12 Using the Alarm Annunciator Function (Release number 3 or later) 1 This section explains how to use the alarm annunciator function. For a description of the function, see section 1.2. 2 • Annunciator Mode 3 Setup Screen Measurement Channels and Alarms Press MENU (to switch to setting mode), hold down FUNC for 3 s (to switch to basic setting mode), and select the Environment tab > Alarm > Action. 4 5 6 • Alarm Levels and Colors See section 3.7.
3.12 Using the Alarm Annunciator Function (Release number 3 or later) • Alarm action > Time off color The window display color when no alarms are activated. You can select white or green. • Levels and Colors See section 3.7. • Annunciator position The position of the annunciator window. See the explanation for the next item. • Annunciator position > On/Off Set the annunciator position that you want to use to On. Starting with 1, consecutively set all annunciator positions that you want to use to On.
3.12 Using the Alarm Annunciator Function (Release number 3 or later) 1 Procedure • Opening the Display The annunciator display appears when you turn on the power. You can switch to the annunciator display from other displays by following the procedure below. 1. Press DISP/ENTER to show the display selection menu. 2 2. Use the up and down arrow keys to select Annunciator, and then press DISP/ ENTER. 3 Measurement Channels and Alarms 4 5 The display appears.
3.12 Using the Alarm Annunciator Function (Release number 3 or later) Explanation • Display Window Layouts and Labels The annunciator display layouts and labels change as indicated in the table below.
3.
3.12 Using the Alarm Annunciator Function (Release number 3 or later) When the relay is set to AND logic ACK ACK Alarm A Occurrence Release Alarm B Occurrence Release Relay Activated Deactivated Alarm B has occurred, so now all alarms have occurred. This causes the relay to be activated.
3.
3.12 Using the Alarm Annunciator Function (Release number 3 or later) When the relay is set to AND logic ACK ACK Alarm A Occurrence Release Alarm B Occurrence Release Relay Activated Deactivated Relay hold Alarm B has occurred, so now all alarms have occurred. This causes the relay to be activated.
3.
3.13 Managing the Input Calibration Interval (/CC1 option; release numbers 4 and later) Manage the input calibration interval to make sure that calibration is performed regularly. For a description of the function, see section 1.1. Setup Screen Press MENU (to switch to setting mode), hold down FUNC for 3 s (to switch to basic setting mode), and select the Menu tab > Set Calibration. Setup Items • Set Calibration > Use/Not Select whether to Use or Not use calibration management.
3.
3.13 Managing the Input Calibration Interval (/CC1 option; release numbers 4 and later) • Checking the Calibration Due Date Carry out the procedure below to show the display. Press MENU (to switch to setting mode) > Set Calibration tab. The date on which the last calibration was completed Displayed according to the date format (see section 2.4) Due date for next calibration Displayed according to the date format (see section 2.
3.13 Managing the Input Calibration Interval (/CC1 option; release numbers 4 and later) • Finishing Calibration 1 Set the next calibration due date. 1. Carry out the procedure below to show the display. Press MENU (to switch to setting mode) > Set Calibration tab > Finish Calibration. 2 A window for setting the calibration due date appears. 3 Measurement Channels and Alarms 4 5 2. Set the next calibration due date, and press DISP/ENTER.
Chapter 4 4.1 Switching Operation Screens Operations in Operation Mode 1 Switching the Screen with the DISP/ENTER Key and Arrow Keys Press DISP/ENTER and arrow keys to show the display selection menu and sub menu to switch the display. The flow of operation is indicated below. DISP/ENTER key and arrow keys TREND Sec. 4.2 GROUP 1 2 3 GROUP n 4 GROUP 1 Display selection menu About tag display Long tags may not fit into their display areas.
4.1 Operations in Operation Mode Operations Using Other Keys Soft keys (see below) START STOP USER FUNC ESC MENU Favorite key (see section 5.15) FUNC key (see below) USER key (see section 7.1) START and STOP keys (see section 6.4) Operation Using the FUNC Key Press FUNC to display the FUNC key menu at the bottom of the screen. Press the Next soft key to switch the menu. Press the desired soft key.
4.1 Operations in Operation Mode 1 Refer to Section 3.8 Section 3.12 Section 5.4 Section 5.4 Sections 6.4 and 2.12 Section 6.6 Section 6.5 Section 6.4 Section 6.4 Section 6.4 Section 4.8 Section 9.4 Section 9.4 Section 9.4 Section 7.1 Section 7.1 Section 7.1 Section 8.1 Section 8.3 IM04L41B01-05EN Section 8.3 Section 5.3 Section 6.3 Section 6.3 IM04L41B01-04 Section 5.15 Section 5.14 Section 2.5 Section 2.
4.2 Displaying the Measured Data as Waveforms, Values, or Bar Graphs This section explains how to use the trend, digital, and bar graph displays. For a description of the function, see section 1.3. Procedure • Showing the Display 1. Press DISP/ENTER to show the display selection menu. 2. Press the arrow keys to select TREND, DIGITAL, or BAR, and press DISP/ ENTER. The selected display appears. • Changing the Displayed Contents 1. Press DISP/ENTER to show the display selection menu. 2.
4.2 Displaying the Measured Data as Waveforms, Values, or Bar Graphs 1 Digital display sub menu 2 Group name: Displays the group TAG DETAIL ON: When a tag does not fit into the typical tag display space, the alarm and measured values are covered so that the tag can be displayed completely. Priority is not given to tag display.
4.2 Displaying the Measured Data as Waveforms, Values, or Bar Graphs Explanation • ALL CHANNEL/GROUP CHANNEL on the Trend Display On the group display, the channels that are assigned to the group are displayed. In all channel display, the waveforms of all channels that are configured to record data are displayed on the current group display.
4.2 Displaying the Measured Data as Waveforms, Values, or Bar Graphs • TAG DETAIL ON/OFF (Release number 3 or later) When TAG DETAIL is set to ON and a tag does not fit into the typical tag display space, it covers the alarm and measured values so that it can be displayed completely. Depending on display space limitations, it may not be possible to display the entire tag. If the tag comment and number do not fit within a display area, they can be scrolled.
4.2 Displaying the Measured Data as Waveforms, Values, or Bar Graphs When the Tag Number Is Displayed When TAG DETAIL is set to off, display priority is given to the tag number. If TAG DETAIL is on, the tag number and comment are displayed as much as possible. With TAG DETAIL OFF With TAG DETAIL ON Tag no. Tag no. Tag comment Tag no. Tag no. Tag comment Tag comment Tag no. Tag no.
4.3 Displaying Past Measured Data (Historical Trend Display) 1 There are five methods to display the past measured data. For a description of the function, see section 1.3. Recall from the display selection menu (see this section). Display from the alarm summary (see section 4.6). Display from the message summary (see section 4.7). Display from the memory summary (see section 4.8). Show the measured data stored on an external storage medium (see section 6.8).
4.3 Displaying Past Measured Data (Historical Trend Display) Historical trend display sub menu Switches to the specified display Returns to the display that was shown before the historical trend Displays the alarm summary in the loaded data file Displays the message summary contained in the loaded data file Displays information about the loaded data file Displays the trend waveform and scale markers of the selected channel in front of all the others. (List items like “ABC-1” are tags.
4.3 Displaying Past Measured Data (Historical Trend Display) 1 Sub menu when the alarm summary is being displayed INFORMATION: Shows information about the measured data that is currently displayed For an explanation of the other menu items, see section 4.6. Sub menu when the message summary is being displayed 2 3 4 For an explanation of the other menu items, see section 4.7. 4. Press DISP/ENTER to change the displayed contents.
4.3 Displaying Past Measured Data (Historical Trend Display) • Moving the Cursor and Scrolling the Waveform Cursor value mark Cursor Moves the cursor up by 1 dot. Moves the cursor down by 1 dot. Hold down an arrow key to move the cursor by 1 division at a time. Use the left and right arrow keys on the horizontal trend display. • Displaying the Continuing Data Approximately one screen of data is shown on the historical trend display.
4.3 Displaying Past Measured Data (Historical Trend Display) • If the Data Does Not Fit in the All Data Display (Release Number 2 or Later) Specify the range to be displayed in the all data display. Below is the procedure to display data that is older than the data displayed currently. Items inside the parentheses are for the horizontal trend display. 1. Press the right (up) arrow key. The waveform of all the data in the display memory is displayed at the right (top) of the screen.
4.3 Displaying Past Measured Data (Historical Trend Display) • Displaying Measured Data from the Specified Date and Time (Release number 3 or later) You can search for measured data from the specified date and time and display the results. You can search the display data or event data in the DX internal memory. 1. Press DISP/ENTER to show the display selection menu. 2. Select DATA SEARCH using the arrow keys, and then press DISP/ENTER. A calendar appears for the month of the data at the cursor position.
4.3 Displaying Past Measured Data (Historical Trend Display) 1 4. Select Display or Event, and press DISP/ENTER. A search time input window appears. 2 3 4 5. Enter the time you want to search for, and press DISP/ENTER. Switching Operation Screens If there is data for the time that you specify, the data appears in the historical trend display. 5 6 7 Display Example 8 9 Display Conditions • The cursor is located at the time that you specify for the search.
4.3 Displaying Past Measured Data (Historical Trend Display) • You can configure the calendar so that weeks start with Sunday or Monday. Procedure Press MENU (to switch to setting mode), hold down FUNC for 3 s (to switch to basic setting mode), and select the Menu tab > Time Settings > Calendar display > 1st weekday. You can set the first weekday (the day that appears on the far left side of the calendar) to SUN (Sunday) or MON (Monday).
4.3 Displaying Past Measured Data (Historical Trend Display) 1 Explanation • ALL CHANNEL/GROUP CHANNEL In the group display, the waveforms of the channels that are registered to the group are displayed. In the all channel display, the waveforms of all channels that have been set to be recorded are displayed on the current group display. The waveforms of channels that are not registered to the group are displayed, without any additional information, in the waveform display area.
4.3 Displaying Past Measured Data (Historical Trend Display) ● FINE GRID With FINE GRID OFF With FINE GRID ON Fine grid • TAG DETAIL When TAG DETAIL is set to ON and a tag does not fit into the typical tag display space, it covers the alarm and measured values so that it can be displayed completely. If the tag comment and number do not fit within a display area, they can be scrolled. The TAG DETAIL setting made in one display affects the settings in all of the other displays.
4.3 Displaying Past Measured Data (Historical Trend Display) • MESSAGE DISP 1, MESSAGE DISP 2 1 • CURSOR VALUE/DIGITAL MAX/MIN Switch between numeric displays. 2 Switch between message displays.
4.3 Displaying Past Measured Data (Historical Trend Display) • TOP CHANNEL (Release number 3 or later) The following example is for when the top channel is set to channel 3. The displayed scale marker and grid are those of the channel selected as the top channel. If you switch from the trend history display to another display, the top channel setting is cleared. Channels other than the top channel are displayed in their assigned order within their group.
4.3 Displaying Past Measured Data (Historical Trend Display) 1 • INFORMATION (Information on the Displayed Measured Data) The following information is displayed. Page switch mark Use the left and right arrow keys to switch the page. 2 3 4 Description File name Data in the internal memory is displayed as “Memory.” For a file on the external storage medium, the file name is displayed. File type Display corresponds to display data, and Event corresponds to event data.
4.4 Display the Statuses of All Channels on One Screen (Overview Display) This section explains how to use the overview display. For a description of the function, see section 1.3. Procedure • Showing the Display 1. Press DISP/ENTER to show the display selection menu. 2. Press the arrow keys to select OVERVIEW, and press DISP/ENTER. The display appears. • Changing the Displayed Contents 1. Press DISP/ENTER to show the display selection menu. 2. Press the right arrow key to display the sub menu. 3.
4.4 Display the Statuses of All Channels on One Screen (Overview Display) • Individual Alarm ACK Operation (Only on DXs with the /AS1 advanced security option) You can perform alarm ACK on individual alarms. This operation is referred to as “individual alarm ACK.” Individual alarm ACK can be performed when the settings are configured in the exact manner described below. • Basic setting > Indicator is set to Hold. For the setting procedure, see section 3.5. • Relay > Relay Action on Ack is set to Reset.
4.4 Display the Statuses of All Channels on One Screen (Overview Display) • TAG DETAIL The same as the TAG DETAIL setting in other displays. The following example is for the DX1012 OVERVIEW display. When the Tag Number Is Not Displayed (the TAG DETAIL does not appear) Tag comments are displayed. Tag comment When the Tag Number Is Displayed When TAG DETAIL is set to off, display priority is given to the tag number. If TAG DETAIL is on, the tag number and comment are displayed as much as possible.
4.5 Displaying Various Information 1 This section explains how to display reports (/M1 and /PM1 options) and how to use the status display. For a description of the function, see section 1.3. 2 • Showing the Display 3 Procedure 1. Press DISP/ENTER to show the display selection menu. 2. Press the up and down arrow keys to select INFORMATION. 4 3. Press the right arrow key to display the sub menu. Switching Operation Screens 4. Press the up and down arrow keys to select the sub menu item.
4.5 Displaying Various Information Carry out the procedure below to switch the displayed report data. Up arrow key: Report data being displayed + 1. Down arrow key: Report data being displayed – 1. Left arrow key: Report data being displayed + 10. Right arrow key: Report data being displayed – 10. Note The display is not updated even if a new report is created while displaying the report data. Perform either of the operations below to display the most recent report data.
4.5 Displaying Various Information • Event Level Switch Status Display (Release number 3 or later) Displays the status of the event level switches. You cannot perform operations in this display.
4.6 Using the Alarm Summary This section explains how to use the alarm summary. For a description of the function, see section 1.3. Procedure • Changing the Displayed Contents 1. Press DISP/ENTER to show the display selection menu. 2. Press the right arrow key to display the sub menu. 3. Press the up and down arrow keys to select the sub menu item.
4.6 Using the Alarm Summary 1 • TAG DETAIL The same as the TAG DETAIL setting in other displays. When the Tag Number Is Not Displayed When TAG DETAIL is on, tag comments are displayed in their entirety. With TAG DETAIL OFF With TAG DETAIL ON 2 3 Tag comment Tag comment 4 Switching Operation Screens 5 When the Tag Number Is Displayed Tag numbers and comments are displayed. 6 Tag comment 7 Tag no.
4.7 Using the Message Summary This section explains how to use the message summary. For a description of the function, see section 1.3. Procedure • Changing the Displayed Contents 1. Press DISP/ENTER to show the display selection menu. 2. Press the right arrow key to display the sub menu. 3. Press the up and down arrow keys to select the sub menu item.
4.7 Using the Message Summary 1 Explanation • CHANGE DISP ITEM Switches between the following two message display methods. • Message, time, and group, or the second of the date and time when the message was written • Message, user name 2 • CHANGE SORT KEY, ASCENDING ORDER, and DESCENDING ORDER 3 • DISP GROUP OFF/ON 4 The messages are sorted in ascending or descending order by the respective key. The sort symbol is displayed next the sort item (see the figure above).
4.8 Using the Memory Summary This section explains how to use the memory summary. For a description of the function, see section 1.3. Procedure • Changing the Displayed Contents 1. Press DISP/ENTER to show the display selection menu. 2. Press the right arrow key to display the sub menu. 3. Press the up and down arrow keys to select the sub menu item. The displayed data type is indicated with a green mark.
4.8 Using the Memory Summary • Saving the Data Save the data in the internal memory to the CF card or the USB flash memory (/USB1 option). For a description of the function, see section 1.4. 1. Press DISP/ENTER to show the display selection menu. 1 2 2. Press the right arrow key to display the submenu. 3. Select DATA SAVE MODE with the up and down arrow keys. 3 4. Press DISP/ENTER. The display switches to DATA SAVE MODE. 5. To save a specified file, select it with the cursor.
4.8 Using the Memory Summary Progress Display When Saving All Data of the Internal Memory (Release Number 2 or Later) If you carry out All Save* on the memory summary screen, a pop-up window appears showing the progress of the save operation. * Function for saving all data in the internal memory to a CF card or USB flash memory. Note • • • The pop-up window appears only when the memory summary display is showing.
4.9 Displaying a List of Operation Logs 4.9 Displaying a List of Operation Logs 1 Displays the following operation logs. *1 Login log , error log, communication log, FTP log, Web log, e-mail log, SNTP log, DHCP *2 *2 log, Modbus status log, operation log , and change settings log *1 Only on DXs without the /AS1 advanced security option *2 Only on DXs with the /AS1 advanced security option 2 3 Procedure • Displaying the Log 1. Press DISP/ENTER to show the display selection menu. 4 2.
4.9 Displaying a List of Operation Logs Factor KEY COM REM ACT SYS Description Key operation Operations via communication Operation through the remote control function Operation through event action Operation by the system • Error Log Error message* Error code* Date/time * See section 10.1, “A List of Messages.
4.9 Displaying a List of Operation Logs 1 • Web Log 2 Operation (see the table on the next page) Error code* Requested operation (see the table below) Date/time * 3 See section 10.1, “A List of Messages.
4.9 Displaying a List of Operation Logs • SNTP Log Error message (detail code)* Error code* Date/time * See section 10.1, “A List of Messages.” • DHCP Log Error message (detail code)* Error code* Date/time * See section 10.1, “A List of Messages.” • Modbus Status Log Command number, command type (R: read, W: write) Communication status* Communication type (C: client, M: master) Date/time * 4-38 See the Communication Interface User’s Manual, IM04L41B01-17E.
4.10 Displaying Stacked Bar Graphs (/M1 and /PM1 options; release number 3 or later) • Operation Log (Only on DXs with the /AS1 advanced security option) Cursor (blue arrow) Move the cursor with the arrow keys. 2 3 Operation type* User name Operation* Date and time 4 To switch displays, in the display selection menu, select LOG > CHANGE DISP ITEM, and press DISP/ENTER.
4.10 Displaying Stacked Bar Graphs (/M1 and /PM1 options; release number 3 or later) This section explains how to use stacked bar graphs. Procedure • Changing the Displayed Contents 1. Press DISP/ENTER to show the display selection menu. 2. Press the right arrow key to display the submenu. 3. Press the up and down arrow keys to select the sub menu item.
4.10 Displaying Stacked Bar Graphs (/M1 and /PM1 options; release number 3 or later) 1 Explanation • SINGLE GRAPH/DUAL GRAPH You can display one or two bar graphs. The sums of the first channel in a group and of all other channels that have the same unit as it are displayed. • SINGLE GRAPH Numeric display section 2 3 4 Display area 2 The displayed report data varies depending on the report kind, which is set using the report function.
4.10 Displaying Stacked Bar Graphs (/M1 and /PM1 options; release number 3 or later) Note The numbers on the vertical axis of display areas 3 and 4 and the dates on the horizontal axis are abbreviated. Display areas 3 and 4 can only display the data from the period immediately preceding that of display area 1 and 2. • Selecting a Bar When SINGLE GRAPH is selected, you can move the cursor to a bar that you want to check, and view the sums of each channel.
Chapter 5 Operations for Changing the Displayed Contents 5.1 Setting Display Groups 1 Assign channels and set the group name for each display group. Set lines at specified positions in the waveform display range on the Trend display. 2 Setup Screen Press MENU (to switch to setting mode), and select the Menu tab > Group set, Trip line. 3 4 5 Operations for Changing the Displayed Contents 6 Setup Items • Group number Select the target group number (1 to 10).
5.1 Setting Display Groups Note The channel settings of a display group can be copied to another group on a DX with release number 2 or later. Procedure 1. Select the copy source channel settings. 2. Press the Copy soft key. 3. Select the copy destination channel settings. 4. Press the Paste soft key. The channel settings are copied. • Trip line Set lines at specified positions in the waveform display range on the Trend display. • On/Off Turn On the trip lines you want to display.
5.2 Displaying Tags or Channel Numbers 1 Display the channels using tags or channel numbers. On DX release numbers 3 and later, tags have tag numbers and tag comments. The tag number is a fixed number that corresponds to the measurement source. The tag comment can be used to list details about the channel. You can choose whether or not to use tag numbers.
5.2 Displaying Tags or Channel Numbers Setup Items • Operating environment > Tag/Channel This setting applies to all channels. Setting Description Tag Displays tag numbers and comments. • If an allotted display space is not large enough to display a tag number and a tag comment, priority is given to the tag number. • Depending on display space limitations, it may not be possible to display the entire tag.
5.3 Setting the Trend Interval and Switching to the Secondary Trend Interval Set the trend interval. Switch the trend interval to the secondary trend interval while the memory sampling is in progress. Automatically write messages when the trend interval is switched. For a description of the function, see section 1.3.
5.3 Setting the Trend Interval and Switching to the Secondary Trend Interval • Trend interval [/div] and Second interval [/div] Select the time corresponding to 1 division of the time axis on the trend display from below: You cannot specify a trend interval that is faster than the scan interval. *1 *1 *2 5s , 10s , 15s , 30s, 1min, 2min, 5min, 10min, 15min, 20min, 30min, 1h, 2h, 4h, and 10h *1 Selectable on the DX1002, DX1004, DX1002N, and DX1004N (release number 3 or later).
5.4 Writing Messages 1 Write messages. 2 Setup Screen • Message Write Group Press MENU (to switch to setting mode), hold down FUNC for 3 s (to switch to basic setting mode), and select the Environment tab > View, Message. 3 4 5 Operations for Changing the Displayed Contents • Setting the Messages 6 Press MENU (to switch to setting mode), and select the Menu tab > Message.
5.4 Writing Messages • Message No. Select the message number (1 to 100). Messages 1 to 10 are common with free messages.* If a message is changed as a free message, the old message is overwritten. * Messages that are written by creating the message on the spot. • Message > Characters Set the message. (up to 32 characters, Aa#1 ) Procedure • Writing Messages Messages cannot be written when the memory sampling is stopped. 1. Display the group to write the message.
5.4 Writing Messages 1 • Writing Free Messages Create a message on the spot and write it. 1. Display the group to write the message. 2. Press FUNC. 2 The FUNC key menu appears. 3. Press the Free message soft key. 4. Press a message number soft key. 3 The message entry window appears. 5. Enter the message. (up to 32 characters, Aa#1 ) 6. Select ENT and press DISP/ENTER. 4 A message mark, time, and message are shown on the trend display.
5.5 Changing the Channel Display Colors Change the channel display colors. The settings are applied to the trend and bar graph displays. Setup Screen Press MENU (to switch to setting mode), and select the Menu tab > Meas channel > Color. Setup Items • Group of channel Select the target channels. • Color To change the color, select from the following 24 colors.
5.6 Displaying Channels in Display Zones 1 Specify a waveform display zone for each channel so that waveforms do not overlap. For a description of the function, see section 1.3. 2 Setup Screen Press MENU (to switch to setting mode), and select the Menu tab > Meas channel > Zone, Scale 3 4 5 Operations for Changing the Displayed Contents 6 Setup Items • First-CH, Last-CH Select the target channels. The target channels are common with the other items that are displayed on the screen.
5.7 Displaying a Scale on the Trend Display Display a scale on the trend display. For a description of the function, see section 1.3. Setup Screen • Scale Position and Number of Scale Divisions Press MENU (to switch to setting mode), and select the Menu tab > Meas channel > Zone, Scale. • Number of Displayed Scale Digits and Current Value Indicator Press MENU (to switch to setting mode), and select the Menu tab > Display > Trend.
5.7 Displaying a Scale on the Trend Display • Scale > Division Set the number of divisions to make with the main scale marks on the trend display to a value from 4 to 12 or C10. C10: The scale is equally divided into 10 sections by main scale marks, and scale values are indicated at 0, 30, 50, 70, and 100% positions on the trend display. The figure below is an example in which each scale is displayed with the position shifted.
5.7 Displaying a Scale on the Trend Display Note • • • • If the scales of multiple channels are set to the same position, the scale of the channel assigned first to the group is displayed. Example: If the order of assignment of a group is 003.002.001, and the scale display position of all channels is set to 1, the scale of channel 3 is displayed at display position 1. Even if some of the scale display positions are skipped, the scale is packed towards display position 1.
5.8 Displaying Alarm Point Marks and Color Scale Band on the Scale Display alarm point marks on the scale. Display the specified range with a color band. For a description of the function, see section 1.3. 1 2 Setup Screen Press MENU (to switch to setting mode), and select the Menu tab > Meas channel > Alarm mark or Color scale band.
5.8 Displaying Alarm Point Marks and Color Scale Band on the Scale • Color scale band Displays a specified section of the measurement range using a color band on the scale. This setting is common with the bar graph display. • Color scale band > Band area Settings Description In Displays the area inside using the color band. Out Displays the area outside using the color band. Off Disables the function. • Color scale band > Color Set the display color.
5.9 Partially Expanding the Waveform 1 Partially expand a waveform (reduce the other sections) on the display. We recommend that you display the scale when viewing partially expanded channels. The numbers for the ends of the scale and the boundary position are displayed, and you can identify the expanded and reduced areas easily. However, numbers are not displayed for other scale marks. For a description of the function, see section 1.3.
5.9 Partially Expanding the Waveform • Partial > Boundary Set the value that is to be the boundary between the reduced section and the expanded section in the range of “minimum span value + 1 digit to maximum span value – 1 digit.” For channels that are set to scaling, the selectable range is “minimum scale value + 1 digit to maximum scale value – 1 digit.” Example: Input range: –6 V to 6V. Expand: 30.
5.10 Changing the Display Layout, Clearing of the Waveform at Start, Message Display Direction, Waveform Line Width, and Grid Change the display layout, clearing of the waveform at start, waveform line width, and grid. For a description of the function, see section 1.3. 1 2 3 Setup Screen Press MENU (to switch to setting mode), and select the Menu tab > Display > Trend.
5.11 Changing the Bar Graph Display Method Change the bar graph display method. For a description of the function, see section 1.3. Setup Screen • Display Direction Press MENU (to switch to setting mode), and select the Menu tab > Display > Bar graph. • Base Position and the Number of Scale Divisions Press MENU (to switch to setting mode), and select the Menu tab > Meas channel > Bar graph. Setup Items • Bar graph > Direction Set the display direction of bar graphs to Horizontal or Vertical.
5.
5.11 Changing the Bar Graph Display Method When the Display Direction of the Bar Graph Is Horizontal The span lower limit (or scale lower limit) becomes the left edge of the bar graph, and the span upper limit (or scale upper limit) becomes the right edge of the bar graph.
5.12 Changing the Background Color of the Display 1 Change the background color of the display. This setting is applied to the operation screens. 2 Press MENU (to switch to setting mode), and select the Menu tab > Display > Monitor. 3 Setup Screen 4 5 Operations for Changing the Displayed Contents 6 Setup Items • Monitor > Background > Display Set the background color of the operation screen to White (default setting) or Black.
5.13 Automatically Switching Display Groups Automatically switch the displayed group at a specified interval. Setup Screen Press MENU (to switch to setting mode), and select the Menu tab > Display > Monitor. Setup Items • Monitor > Scroll time Set the switching interval from the available settings between 5 s and 1 min. The groups switch in ascending order. Select whether to automatically switch on the display selection menu. See section 4.
5.14 Automatically Switching Back to the Default Display 1 Show a preset display when there is no operation for a specific time. 2 Setup Screen Press MENU (to switch to setting mode), and select the Menu tab > Display > Monitor. 3 4 5 Operations for Changing the Displayed Contents Setup Items 6 • Monitor > Jump default display Returns to a preset display if there is no key operation for a specific time. Settings Description 1min to 1h Time until switching the display.
5.15 Using the Favorite Key Register a frequently used display to the Favorite key and enable the display to be shown through simple operation. START STOP USER FUNC ESC MENU Favorite key Setup Screen • FAVORITE Key action (Release number 3 or later) Press MENU (to switch to setting mode), and select the Menu tab > Display > FAVORITE Key action.
5.15 Using the Favorite Key 1 Procedure • Registering the Display Up to 8 displays can be registered. 2 1. In the operation mode, show the display you want to register. 2. Press FUNC. The FUNC key menu appears. 3. Press the Favorite regist soft key. Then, press a registration number soft key. 4. Press the Regist soft key. A window appears for you to enter the display name. * To delete a registration, press the Delete soft key. 5. Enter the display name (using up to 16 characters, 3 4 A a # 1 ).
5.16 Writing a Message When the DX Recovers from a Power Failure A message is written to the trend display when the DX recovers from a power failure while memory sampling is in progress. Setup Screen • Power-fail message Press MENU (to switch to setting mode), hold down FUNC for 3 s (to switch to basic setting mode), and select the Environment tab > View, Message.
5.17 Changing the FUNC Key Menu and Display Selection Menu 1 Change the FUNC key menu that appears when the FUNC key is pressed and the display selection menu that appears when the DISP/ENTER key is pressed. If you are using the multi batch function (/BT2 option), see the DX1000/DX1000N/ DX2000 Multi Batch (/BT2) User’s Manual, IM04L41B01-03E. 2 3 Setup Screen • FUNC Key Menu Press MENU (to switch to setting mode), and select the Menu tab > Menu customize > Function menu.
5.17 Changing the FUNC Key Menu and Display Selection Menu • Description of the FUNC Key Menus For a description of each item, see section 4.1. • Enabling/Disabling the Display Selection Menu and Sub Menu Items whose menu name is white are shown. 1. Press the arrow keys to select a menu item. 2. Press the View or Hide soft key. If you press the Hide soft key, the menu name is displayed in gray, and does not appear in the display selection menu.
5.17 Changing the FUNC Key Menu and Display Selection Menu 1 • Description of the Display Selection Menus and Sub Menus Items with asterisk (*) are set to Hide by default. Display Selection Menu TREND * TREND HISTORY DIGITAL BAR OVERVIEW * * ANNUNCIATOR ACK ALARM 2 *2 ACK ALARM 3 *2 ACK ALARM 4 *2 — Reference Section Section 4.2 Section 4.2 Section 4.2 Section 4.2 Section 4.2 Section 4.2 Section 4.2 Section 4.2 Section 4.2 Section 4.2 Section 4.3 Section 4.2 Section 4.2 Section 4.
5.17 Changing the FUNC Key Menu and Display Selection Menu Display Selection Menu INFORMATION * * * * * *Log Sub Menu ALARM SUMMARY MESSAGE SUMMARY MEMORY SUMMARY TAG DETAIL ON/OFF MODBUS CLIENT MODBUS MASTER RELAY EVENT SWITCH REPORT DATA COLUMN BAR TO HISTORY TO HISTORY(DISP) TO HISTORY(EV) TO OVERVIEW DISP GROUP OFF/ON CHANGE SORT KEY ASCENDING ORDER/ DESCENDING ORDER Reference Section Section 4.5 Section 4.5 Section 4.5 Section 4.6 Section 4.5 Section 4.5 Section 4.5 Section 4.
5.18 Displaying Comments (Release number 3 or later) 1 Register text strings to comment text fields and combine comment text fields to create comment text blocks. • You can display the text from a comment text block when a certain event occurs (an alarm for example). • You can use comment text block text for annunciator window labels (see section 3.12 for details).
5.18 Displaying Comments (Release number 3 or later) Setup Items • Comment txt field no, Text info You can register a comment to a specified comment text field (field 1 to 100). Text info: you can enter up to 32 characters ( A a # 1 ). • Comment txt block no, Comment txt field no You can register a comment to a specified comment text block (block 1 to 50). Register comments to comment text blocks by combining up to 5 comment text fields.
Chapter 6 6.1 Saving and Loading Data Setting the Recording Conditions of the Measured Data 1 Set the method for recording the measured data. For a description of the function, see section 1.4. 2 Setup Screen • Data Type Press MENU (to switch to setting mode), hold down FUNC for 3 s (to switch to basic setting mode), and select the Menu tab > A/D, Memory.
6.1 Setting the Recording Conditions of the Measured Data • Recording Conditions of Event Data Press MENU (to switch to setting mode), and select the Menu tab > Data save > Event data. Setup Items • Memory > Data kind Settings Display E+D Description Records display data. Records display data and event data. This setting cannot be selected when the trend interval switching function is set to On.
6.1 Setting the Recording Conditions of the Measured Data 1 • Event data (when recording event data) • Sample rate Select the data recording interval. Use the table under “Data length” for reference. • Mode 2 Settings Description Free Records data continuously. Single Records data when the trigger condition is met. Repeat Records data each time the trigger condition is met.
6.2 Setting the Method for Saving the Data Set the method for recording the measured data to the storage medium. For a description of the function, see section 1.4. Setup Screen • Auto save Press MENU (to switch to setting mode), hold down FUNC for 3 s (to switch to basic setting mode), and select the Environment tab > Security, Media save. • File header, Data file name Press MENU (to switch to setting mode), and select the Menu tab > Data save > File header, File name.
6.2 Setting the Method for Saving the Data 1 Setup Items • Save > Auto save Settings On Off Description Automatically saves the measured data to the CF card. Specify On to enable the media FIFO function. Does not automatically save the data. Save the measured data manually to the CF card or USB flash memory (/USB1 option). 2 3 • Save > Media FIFO (Release Number 2 or Later) This item appears if Auto save is set to On. Settings On Off Description Enable media FIFO.
6.3 Using the Batch Function Set the batch function. For a description of the function, see section 1.5. Setup Screen • Batch Function Press MENU (to switch to setting mode), hold down FUNC for 3 s (to switch to basic setting mode), and select the Environment tab > Batch. • Data file name Press MENU (to switch to setting mode), and select the Menu tab > Data save > File header, File name. • Text Field Press MENU (to switch to setting mode), and select the Menu tab > Data save > Batch text.
6.3 Using the Batch Function 1 Setup Items • Batch > On/Off Select On to use the batch function. For details on MultiBatch, see IM04L41B01-03E. 2 • Batch > Lot-No. digit Select the number of digits of the lot number from 4, 6, or 8. Select Off to disable the lot number. • Batch > Auto increment Settings Description On Automatically sets the lot number of the next measurement to “the lot number of the current measurement + 1.” Off Disables the operation described above.
6.3 Using the Batch Function • Displaying the Text Field Settings If you are using the multi batch function (/BT2 option), see the DX1000/DX1000N/ DX2000 Multi Batch (/BT2) User’s Manual, IM04L41B01-03E. 1. In the operation mode, press FUNC. The FUNC key menu appears. 2. Press the Text field soft key. The text field settings are displayed. Page switch mark (release number 3 and later) Eight text fields are displayed on a single page. Use the left and right arrow keys to switch the page.
6.3 Using the Batch Function 1 3. Select Input, and press DISP/ENTER. The text field screen appears (release numbers 4 and later). 2 The settings that you made in setting mode appear here. 3 Select a text field number, and enter text. However, you cannot specify the Tilte of field. (Firmware version numbers 4.11 and later) Press DISP/ENTER. 4 5 The start recording screen will appear.
6.4 Starting/Stopping the Recording and Saving the Measured data Start the recording and save the measured data to the external storage medium. For a description of the function, see section 1.4. Procedure • Starting the Recording (Memory Start) Press START. The internal memory icon in the status display section changes from the stop icon to memory sampling icon. • When recording display data or event data in free mode, recording starts.
6.4 Starting/Stopping the Recording and Saving the Measured data • Saving Measured Data Manually (Collectively Storing Unsaved Data) Automatic saving takes place when Auto save is set to Off (see section 6.2 for details). You can save to a CF card or to USB flash memory (/USB1 option). The procedure for saving unsaved data to a CF card is described below. For the procedure to save data to the USB flash memory, see section 2.12. 1 2 1. Insert the CF card.
6.4 Starting/Stopping the Recording and Saving the Measured data Explanation • Operations That Start Simultaneously with Memory Start • Waveform display updating on the trend display. • Report (/M1 and /PM1 options) • The computation function (/M1 and /PM1 options) can be configured to start simultaneously with memory start. See section 9.4. • Operations That Stop Simultaneously with Memory Stop • Waveform display updating on the trend display.
6.4 Starting/Stopping the Recording and Saving the Measured data • Changing Settings and Performing File Operations during Recording (Memory sampling) If you are using the multi batch function (/BT2 option), if even one batch group is being recorded, the DX is recording (memory sampling). On DXs without the /AS1 advanced security option You can change all settings except for the ones listed below.
6.5 Manually Saving the Measured Data (Manual Sample) Save the instantaneous values of all channels (excluding those set to Skip or Off) through key operation. For a description of the function, see section 1.4. Procedure 1. In the operation mode, press FUNC. The FUNC key menu appears. 2. Press the Manual sample soft key. Manual sampling is executed.
6.6 Saving the Screen Image Data (Snapshot) 1 Save the current screen image data to the CF card. This operation is called snapshot, and the screen image data file is called snapshot data file. For a description of the function, see section 1.4. Procedure 2 3 1. In the operation mode, press FUNC. The FUNC key menu appears. 2. Press the Snap shot soft key. The snapshot data file is saved to the CF card. Image of the soft keys and the message window are not saved.
6.7 Managing the Files on the Storage Medium This section explains how to display a list of files on the storage medium, check the free space, delete files and directories, and format the storage medium. Procedure • Displaying a List of Files on the Storage Medium, Deleting Files, and Checking the Free Space Carry out the procedure below to show the display. Press MENU (to switch to setting mode), and select the File tab > File list, delete > * press the CF or USB soft key > and press DISP/ENTER.
6.7 Managing the Files on the Storage Medium Deleting a File Press the arrow keys to select the file to be deleted, and press the Delete soft key. A confirmation window appears. Select Yes, and press DISP/ENTER. The file is deleted. This operation cannot be performed on DXs with the /AS1 advanced security option. Deleting a Directory First, delete all the files in the directory. Select the directory you want to delete. The rest of the procedure is the same as deleting a file.
6.8 Loading and Displaying the Measured Data in the Storage Medium Load the display or event data file saved on the external storage medium and display the waveform. The loaded data is shown on the historical trend display. For the operations on the historical trend display, see section 4.3. Procedure • Loading a File 1. Carry out the procedure below to show the display. Press MENU (to switch to setting mode), and select the File tab > Load display * data or Load event data.
6.9 Saving/Loading the Setup Data 1 Save the setup data to the external storage medium or load the setup data from the external storage medium. 2 Procedure • Saving the Setup Data 3 1. Carry out the procedure below to show the display. Press MENU (to switch to setting mode), and select the File tab > Save settings. * Press the CF or USB soft key , and then press DISP/ENTER. * When a CF card and a USB flash memory (/USB1 option) are being used.
6.9 Saving/Loading the Setup Data • Loading the Setup Data for the Setting Mode and Basic Setting Mode 1. Carry out the procedure below to show the display. On DXs without the /AS1 advanced security option Press MENU (to switch to setting mode), hold down FUNC for 3 s (to switch to basic setting mode), and select the File/Initialize tab > Load settings. Press the * CF or USB soft key , and then press DISP/ENTER. * When you are using a CF card and USB flash memory (/USB1 option).
6.9 Saving/Loading the Setup Data 1 Explanation • Setup Data File On DXs without the /AS1 advanced security option • The setup data file extension is .PDL. • The maximum setup data file size is approximately 250 KB. • The following settings are also saved. • Current monitor display conditions • Default display registration data • Favorite key registration data 2 On DXs with the /AS1 advanced security option 4 3 • The setup data file extension is .PEL.
6.10 Loading and Saving Report Templates (/M1 and /PM1 options; release numbers 4 and later) This section explains the procedures for loading a report template (.xml extension) from an external storage medium and for saving a report template from the internal memory to an external storage medium. Procedure • Loading a Template File 1. Carry out the procedure below to show the display. Press MENU (to switch to setting mode), and select the File tab > Load template.
6.10 Loading and Saving Report Templates (/M1 and /PM1 options; release numbers 4 and later) 1 • Saving a Template File 1. Carry out the procedure below to show the display. Press MENU (to switch to setting mode), and select the File tab > Save template. Press the CF or USB soft key*, and then press DISP/ENTER. * When you are using a CF card and USB flash memory (/USB1 option).
6.10 Loading and Saving Report Templates (/M1 and /PM1 options; release numbers 4 and later) Explanation • Report Template Files • The report template file name extension is .xml. • The DX can only handle template files that are 400 KB or smaller.
Chapter 7 Customizing Actions Using the Event Action and Remote Control Functions (/R1 and /PM1 Options) 7.1 Setting the Event Action Function (Including the remote control function of the /R1 and / PM1 options and the USER key) 1 A specified action is carried out when an event occurs. This function is called event action. The remote control function (/R1 option) and the USER key are set by the event action. For a description of the function, see section 1.6.
7.1 Setting the Event Action Function (Including the remote control function of the /R1 and /PM1 options and the USER key) Setup Items • Logic box number You can set up to 40. • Event action > Event The condition to execute the action. Settings Description None Not use. Remote Select the remote control input terminal number. Relay Select the alarm output relay number.During Edge operation, a change from deactivated to activated is an event.
7.1 Setting the Event Action Function (Including the remote control function of the /R1 and /PM1 options and the USER key) 1 • Event action > Action The action to be executed when an event occurs. Settings Description Memory - Start - Stop - Trigger* Can be specified when the DX is configured to record event data. 2 AlarmACK Cannot be specified when the event is set to Relay, Switch, or Alarm. Math Can be specified on /M1 and /PM1 options. MathStrt Start computation.
7.1 Setting the Event Action Function (Including the remote control function of the /R1 and /PM1 options and the USER key) • Timer Timer used by event action. Used also in the TLOG computation of the computation function. * The timer cannot be changed while memory sampling or computation is in progress. • Timer No. Up to four timers (1 to 4) can be set. When Using an Absolute Timer • Mode Select Absolute. • Interval Select the interval from the available settings between 1min to 24h. • Ref.
7.1 Setting the Event Action Function (Including the remote control function of the /R1 and /PM1 options and the USER key) 1 • Kind Setting Day Week Month Year Description The condition is matched once a day. The condition is matched once a week. The condition is matched once a month. The condition is matched once a year. This function is available for release numbers 3 and later. 2 Set the items with check marks in the following table depending on the Kind setting.
7.1 Setting the Event Action Function (Including the remote control function of the /R1 and /PM1 options and the USER key) • Displaying an Event Level Switch Status List (Release number 3 or later) Display the status of the event level switch. For the operating procedure, see section 4.5. • Resetting the Match Time Timer (Release number 3 or later) Operation ends when a match time timer whose timer action is set to single expires. To use such a match time timer again, you must reset it. 1.
7.2 Setup Examples of Event Action 1 Example 1: S tarting/Stopping the Memory Sampling through Remote Control (/R1 Option) 2 Starts/Stops the memory sampling when a signal is applied to remote control input terminal 2. Use logic box number 1. 3 • Setup Screen and Setup Items Press MENU (to switch to setting mode), and select the Menu tab > Timer, Event action > Event action.
7.2 Setup Examples of Event Action Example 3: Saving the Data Every Day at Hour 17 Save the recorded data to the CF card every day at hour 17. Use logic box number 3. Use match time condition 1. • Setup Screen and Setup Items Logic box number 3 Press MENU (to switch to setting mode), and select the Menu tab > Timer, Event action > Event action. Match Time Condition Press MENU (to switch to setting mode), and select the Menu tab > Timer, Event action > Match time timer.
7.2 Setup Examples of Event Action 1 Example 4: R eleasing the Alarm Output Using the USER Key (Alarm Acknowledge Operation) Release the activated alarm output by pressing the USER key. Use logic box number 4. 2 • Setup Screen and Setup Items Press MENU (to switch to setting mode), and select the Menu tab > Timer, Event action > Event action. 3 4 5 Press the USER key to release the activated alarm indication and relay output.
7.3 Changing the Response to Remote Contact Input Opening and Closing (/R1 and /PM1 options; release number 3 or later) Set the remote contact input operation. Setup Screen Press MENU (to switch to setting mode), hold down FUNC for 3 s (to switch to basic setting mode), and select the Environment tab > Remote. Setup Items • Remote Input > 1 to 8 Specify an operation for each remote control terminal. Five remote control terminals can be used for pulse input (/PM1 option). Setting N.
Chapter 8 8.1 Using the Security Function Disabling the Key Operation (Key Lock Function) 1 Disable the key operation. For a description of the function, see section 1.7. This operation cannot be performed on DXs with the /AS1 advanced security option. 2 3 Setup Screen • Selecting the Key Lock Function Press MENU (to switch to setting mode), hold down FUNC for 3 s (to switch to basic setting mode), and select the Environment tab > Security, Media save.
8.1 Disabling the Key Operation (Key Lock Function) • Key action, Media/USB or Action of Function Select whether to lock each item. Settings Description Free Key lock not applied. Lock Disables the operation. Procedure • Locking the Keys 1. In the operation mode, press FUNC. The FUNC key menu appears. 2. Press the Keylock soft key. The key lock is activated. The key lock icon appears in the status display section. • Releasing the Key Lock 1. In the operation mode, press FUNC.
8.2 Enabling Only Registered Users to Operate the DX (Login Function) Only registered users can operate the DX. For a description of the function, see section 1.7. For information about using this function on a DX with the /AS1 advanced security option, see the Advanced Security Function (/AS1) User’s Manual, IM04L41B01-05EN.
8.2 Enabling Only Registered Users to Operate the DX (Login Function) • Registering Users Press MENU (to switch to setting mode), hold down FUNC for 3 s (to switch to basic setting mode), and select the Menu tab > Login > User settings. • User Privileges Press MENU (to switch to setting mode), hold down FUNC for 3 s (to switch to basic setting mode), and select the Menu tab > Login > Authority of user >Key Action, Media or Action of Function.
8.2 Enabling Only Registered Users to Operate the DX (Login Function) 1 • User basic settings > Operation without login Sets the operation that the user can carry out when logged out. Settings Description Off Only login operation is available. Display Allows the user to switch the operation screen in addition to the login operation. 2 • Admin number Up to five administrators can be registered. Be sure to register at least one administrator.
8.3 Logging in and Logging Out This section explains the procedure to log into the DX using keys. For the procedure to log into the DX via communications, see the Communication Interface User’s Manual, IM04L41B01-17E. For information about using this function on a DX with the /AS1 advanced security option, see the Advanced Security Function (/AS1) User’s Manual, IM04L41B0105EN. Procedure • Logging In 1. In the operation mode, press FUNC. A list of registered user names appears. 2.
8.3 Logging in and Logging Out 1 • Changing the Password Using Keys 1. In the operation mode, press FUNC. The FUNC key menu appears. 2 2. Press the Password change soft key. A window appears for you to enter the current password. 3. Enter the current password, select ENT, and press DISP/ENTER. 3 A window appears for you to enter the new password. 4. Enter the new password, select ENT, and press DISP/ENTER. A window appears for you to enter the new password again. 5.
Chapter 9 9.1 Computation and Report Functions (/M1 and /PM1 Options) Setting the Expression, Measurement Range, Alarm, Tag, and Data Storage on Computation Channels This section explains how to set a computation channel’s expression, measurement range, tag, alarm, and recording On/Off. You cannot set expressions or constants while memory sampling or computation is in progress. For a description of the function, see section 1.8.
9.1 Setting the Expression, Measurement Range, Alarm, Tag, and Data Storage on Computation Channels • Conditions of TLOG Computation and Rolling Average Press MENU (to switch to setting mode), and select the Menu tab > Math channel > TLOG, Rolling average. • Display for Computation Errors and Handling of Overflow Data in Statistical Computation Press MENU (to switch to setting mode), hold down FUNC for 3 s (to switch to basic setting mode), and select the Environment tab > Math.
9.1 Setting the Expression, Measurement Range, Alarm, Tag, and Data Storage on Computation Channels • Span_L, Span_U 1 • Unit 2 Set the measurement range. Selectable range of values: –9999999 to 99999999 Selectable decimal places: X.XXXX, XX.XXX, XXX.XX, XXXX.X Set the unit of the computed value (Up to 6 characters, Aa#1 ). • Alarm The available alarm types are high limit alarm, low limit alarm, delay high limit alarm, and delay low limit alarm.
9.1 Setting the Expression, Measurement Range, Alarm, Tag, and Data Storage on Computation Channels • Rolling average • On/Off To take the rolling average of the measured results, select On. • Interval Select the sampling interval when taking the rolling average from the following: The sampling interval takes on a value that is an integer multiple of the scan interval. For example, if the sampling interval is set to 5 s when the scan interval is 2 s, the actual sampling interval is 6 s.
9.2 Writing Expressions 1 This section explains the meaning and how to write expressions. Common Items 2 Follow the rules below when writing expressions. • Use up to 120 characters to write expressions. • The precedence of computing terms can be specified using parentheses. • Specify the channels in the expression using channel numbers.
9.2 Writing Expressions Four Arithmetic Operation Expression Example • Addition • Subtraction 001+002 (Determines the sum of the measured values of channel 1 and channel 2.) 001–002 (Determines the difference of the measured values of channel 1 and channel 2.) • Multiplication 001*K03 (Multiplies constant K03 to the measured value of channel 1.) 001/K02 • Division (Divides the measured value of channel 1 by constant K02.
9.2 Writing Expressions 1 Logical Computation Checks whether the two data values, e1 and e2 (e1 only for NOT), are zeroes or nonzeroes, and computes according to the conditions. AND 2 Logical product (Syntax) e1ANDe2 (Condition) If the two data values e1 and e2 are both non-zeroes, the computed result is “1.” Otherwise, it is “0.
9.2 Writing Expressions TLOG Computation In the explanation below, an expression containing a computing element in e1, an internal switch (S), a relay (I), or flag (F) cannot be written. In addition, only one TLOG computation can be specified in a single computing equation. TLOG.MAX( ) Maximum value (Syntax) TLOG.MAX(e1) (Condition) Determines the maximum value of channel e1. TLOG.MIN( ) Minimum value (Syntax) TLOG.MIN(e1) (Condition) Determines the minimum value of channel e1. TLOG.
9.2 Writing Expressions CLOG Computation Only data of measurement channels and computation channels can be used in the CLOG computation. Up to 30 channels can be written in the parentheses. In the explanation below, an expression containing a computing element cannot be written to e1, etc. In addition, only one CLOG computation can be specified in a single computing equation. 1 2 CLOG.SUM( ) Sum value (Syntax) (Condition) CLOG.SUM(e1.e2.
9.2 Writing Expressions Special Computation PRE( ) (Syntax) (Condition) HOLD(a):b (Syntax) (Condition) RESET(a):b (Syntax) (Condition) CARRY(a):b (Syntax) (Condition) (Description) PRE(e1) Determines the previous value of e1. HOLD(a):b When a is zero, b is carried out to derive the computed value. Otherwise, the previous computed value is held. RESET(a):b When a is zero, b is carried out to derive the computed value.
9.3 Displaying the Computation Channels 1 Computation channels can be assigned to groups and displayed in a similar manner to measurement channels. For a description of the function, see section 1.8. 2 Setup Screen • Color Press MENU (to switch to setting mode), and select the Menu tab > Math channel > Color. 3 4 5 6 • Zone Display and Scale Display Press MENU (to switch to setting mode), and select the Menu tab > Math channel > Zone, Scale.
9.3 Displaying the Computation Channels • Partial Expanded Display Press MENU (to switch to setting mode), and select the Menu tab > Math channel > Partial. * The Partial command appears in the menu if you set Partial to On in Basic Setting Mode. • Alarm Marks Press MENU (to switch to setting mode), and select the Menu tab > Math channel > Alarm mark. • Color Scale Band Press MENU (to switch to setting mode), and select the Menu tab > Math channel > Color scale band.
9.3 Displaying the Computation Channels 1 Setup Items • Group of channel, First-CH, and Last-CH Select the target channel range. 2 • Color See section 5.5. • Zone 3 See section 5.6. • Partial See section 5.9. 4 • Bar graph See section 5.11. • Scale 5 See section 5.7. • Alarm mark color and Color scale band See section 5.8.
9.4 Starting/Stopping Computation, Resetting Computation, and Releasing Computation Data Dropout Display Setup Screen • Action Taken When the START Key Is Pressed Press MENU (to switch to setting mode), and select the Menu tab > Math channel > Math start action. Setup Items • Math start action > Math start Settings Description Off Does not start the computation even when the START key is pressed. Start Starts the computation when the START key is pressed.
9.4 Starting/Stopping Computation, Resetting Computation, and Releasing Computation Data Dropout Display • Stopping the Computation • Stopping the Computation Simultaneously with the Memory Sampling 1 1. Press STOP. A confirmation dialog box appears. 2 3 4 2. Select Mem+Math and press DISP/ENTER. The memory sampling and computation stop, and the computation icon in the status display section disappears. • Stopping Only the Computation 5 6 1. In the operation mode, press FUNC.
9.5 Creating Reports Set how the reports are created. For a description of the function, see section 1.8. Setup Screen • Report Computation Type Press MENU (to switch to setting mode), hold down FUNC for 3 s (to switch to basic setting mode), and select the Environment tab > Report. • Report Type and Time of Creation Press MENU (to switch to setting mode), hold down FUNC for 3 s (to switch to basic setting mode), and select the Menu tab > Report > Basic settings.
9.5 Creating Reports 1 Setup Items • Report > Report select > 1, 2, 3, and 4 Select the type of data to output as reports. The only data type that can be set more than once is Off. You cannot set 1 to Off. Settings Description Off Does not output reports. Ave Outputs the average value. Max Outputs the maximum value. Min Outputs the minimum value. Sum Outputs the sum value. Inst Outputs the instantaneous value.
9.5 Creating Reports • Report channel number The report is output in order by this number. • Report channel number > On/Off Select On for the report channels to be used. • Report channel number > Channel Set the channel to assign to the report channel. All channels can be assigned, but reports are not created for channels set to Skip or Off even if they are assigned. In the stacked bar graph display (see section 4.10 for details), report data is displayed in the following groups.
9.6 Creating a Report Template (Release numbers 4 and later) This section explains how to make a report template. To create a report template, you put keywords and text into cells in Excel. Keywords specify the data that will be entered into a cell. Other text is included in the report as it is written. Save the report templates that you create in XML spreadsheet format. The report template file name extension is .xml. For a description of the function, see section 1.8.
9.6 Creating a Report Template (Release numbers 4 and later) Keyword Format Keywords are written by themselves or with parameters. $ Keyword(parameter)$ Example: $ReportDataSum(Hour,R01,00,23)$ • Basic Rules • The dollar sign on the left indicates the start of a keyword, and the dollar sign on the right indicates the end of a keyword. • You can only write keywords using letters of the alphabet, dollar signs, parentheses, commas, and spaces.
9.6 Creating a Report Template (Release numbers 4 and later) 1 Keyword Definitions For examples of how to use the keywords, see “Report Template Examples.” • System Keywords One keyword produces one item of data.
9.
9.
9.6 Creating a Report Template (Release numbers 4 and later) Keywords in merged cells are affected by the leftmost cells above them. $ReportDataInst(Hour,R01)$ $Repeat$ $Repeat$ $Repeat$ ↓ 101 102 $ReportDataInst(Hour,R02)$ $Repeat$ $Repeat$ $Repeat$ 201 202 203 204 103 When a keyword is written incorrectly or its formatting is wrong, the keyword will be output to the file as it is written.
Chapter 10 Troubleshooting 10.1 A List of Messages 1 There are cases in which error codes and messages are displayed on the screen during operation. A list of the possible error codes and messages are given in the table below. Communication error codes and messages are also listed. Error responses to communication commands are output in English. 3 Errors Related to Parameter Settings • Setting Errors Code 1 2 3 4 5 6 7 8 9 11 12 13 21 22 23 24 25 31 35 36 37 40 41 42 Message System error.
10.1 A List of Messages Code 43 Message A channel number cannot repeat in a group. 45 46 There is no character string saved in the clipboard. The character string saved in the clipboard is too long. 47 Start and end time cannot match. 48 Invalid or missing DST time settings. 61 There is no channel specified by the MATH expression. 62 MATH expression grammar is incorrect. 63 MATH expression sequence is incorrect. 64 MATH upper and lower span values are equal.
10.1 A List of Messages Code 96 Message This menu is locked. 97 This function is locked. 100 IP address doesn’t belong to class A, B, or C. 101 The result of the masked IP address is all 0s or 1s. 102 SUBNET mask is incorrect. 103 The net part of default gateway is not equal to that of IP address. 105 This port number is already in use. Please enter a different number. 110 This user name is not registered. 111 The login user ID is incorrect.
10.1 A List of Messages Code 132 Message You have exceeded the available number of commands. 133 External I/O auto setting information is not available. 134 Auto setting has already been executed. 135 External I/O cannot be found. 136 External I/O start cannot be executed. 137 DNS for this device is not set. 138 Cannot create object. The maximum allowed number was exceeded. 139 This dependency is not possible. 140 You cannot set this while you are logged in.
10.1 A List of Messages • Code 150 151 152 153 154 155 156 157 158 159 162 163 164 170 173 174 175 701 702 760 761 764 Message This action is not possible because sampling is in progress. Explanation/Countermeasures/Ref. section Stop the memory sampling and then execute. See section 6.4. This action is not possible during sampling or calculating. Stop the memory sampling and then execute. See sections 6.4 and 9.4. This action is not possible because saving is in progress.
10.1 A List of Messages Code 765 Message Preauthentication failed. 766 The encryption type is not supported by this machine. 767 Failed to receive authentication from KDC server. 768 Change the password. 769 The time difference with the KDC server exceeds the limit. 771 The host principal is not registered. 772 The host principal is invalid. 773 The host password is incorrect. 774 Preauthentication failed. 775 The realm is incorrect. 10-6 Explanation/Countermeasures/Ref.
10.1 A List of Messages Operation Errors Message Operation aborted because an error was found in media. 201 Not enough free space on media. 202 210 211 Media is read-only. Media has not been inserted. Media is damaged or not formatted. 212 Format error. 213 214 The file is read-only. There is no file or directory. 215 Exceeded the allowable number of directories or files. 216 The file or directory name is incorrect. 217 Unknown file type. 218 219 This directory or file now exists.
10.1 A List of Messages Code 250 Message Failed to load template file. 251 There is no template file. 252 The template file is incorrect. 10-8 Explanation/Countermeasures/Ref. section The template file that you attempted to load is 400 KB or larger. Load a template file that is smaller than 400 KB. There is no template file in the internal memory. Load a template file. Check the template file format.
10.1 A List of Messages 1 Communication Application Errors • Errors Related to E-mail and Web Server 260 IP address is not set or ethernet function is not available. 261 SMTP server is not found. 262 Cannot initiate E-mail transmission. 263 Sender’s address rejected by the server. 264 Some recipients’ addresses are invalid. 265 SMTP protocol error. 266 Ethernet cable is not connected. 267 Could not connect to SMTP server. E-mail transmission request failed. E-mail transfer error.
10.1 A List of Messages • Errors Related to FTP Client For a description of the FTP client function of the DX, see the Communication Interface User’s Manual, IM 04L41B01-17E. The detail code does not appear in the error message on the screen. You can view the code on the FTP log display of the DX or using the FTP log output via communications. Code 280 281 282 10-10 Message IP address is not set or FTP function is not available.
10.1 A List of Messages Code 283 284 Message 1 2 3 4 5 6 7 8 9 10 Troubleshooting Check that the server does not drop the connection and that it responds within the proper time period. SERVER The server is not in a condition to provide the service. Check that the server is in a condition in which service can be provided. FTP command was not accepted. Further details are provided by the character string that appears after error code 283. Character String and Details USER Failed to verify the user name.
10.1 A List of Messages Code 285 286 287 290 291 292 293 10-12 Message FTP data connection error. Further details are provided by the character string that appears after error code 285. Character String and Details SOCKET Failed to create a socket for the transfer connection.*2 BIND Failed the transfer connection command.*2 CONNECT Failed the transfer connection.*2 LISTEN Failed the transfer connection reception.*2 ACCEPT Failed to accept the transfer connection.*2 SOCKNAME Internal processing error.
10.1 A List of Messages Code 294 295 296 297 1 2 3 4 5 6 7 8 9 10 Troubleshooting Message No time correction because excess time deviation with SNTP server. Further details are provided by the character string that appears after error code 294. Character String and Details OVER This error occurs when periodic SNTP is executed by the auto setting of the clock and the clock is not adjusted because the time difference between the DX and the SNTP server is greater than or equal to 10 minutes.
10.1 A List of Messages Code 298 700 701 702 Message Deletion of the hostname to the DNS server failed. Further details are provided by the character string that appears after error code 298. Character String and Details INTERNAL Failed to delete the host name (transmission error, reception timeout, etc.). FORMERR Failed to delete the host name (format error: DNS message syntax error). SERVFAIL Failed to delete the host name (server failure: DNS server processing error).
10.1 A List of Messages 1 Communication Errors For information regarding the communication function of the DX, see the Communication Interface User’s Manual, IM 04L41B01-17E. 2 • Errors during Setting and Basic Setting Modes, Output Communication Command Execution, and Setup Data Loading Code 300 301 302 303 350 Message Command is too long. Too many number of commands delimited with ‘;’. This command has not been defined. Data request command can not be enumerated with sub-delimiter.
10.1 A List of Messages • Other Communication Errors An English error message is returned via the communication interface. It is not displayed on the screen. Code 400 401 402 403 404 405 406 407 408 409 410 411 420 421 422 450 451 452 10-16 Message Input username. Enter the name of a user that is registered on the DX and that is allowed to log in to the DX through communication. Input password. Enter the password. Select username from ‘admin’ or ‘user’.
10.1 A List of Messages 1 Status Messages Code 500 501 503 504 505 506 508 509 510 511 513 514 515 516 520 521 530 531 532 533 534 535 542 543 550 551 552 553 554 555 556 557 558 559 560 561 Message Execution is complete. Please wait a moment... Data are being saved to media... File is being loaded from media... Formatting... Memory save to media was interrupted. There is no file or directory. Press [DISP/ENTER] key to display file name. Range cannot be changed during sampling or calculating.
10.1 A List of Messages Code 562 563 564 565 566 567 568 571 572 573 10-18 Message Ethernet cable is disconnected. Further details are provided by the character string that appears after error code 562. Character String and Details ON Detected that an Ethernet cable was connected. OFF Detected that an Ethernet cable was disconnected. The command is sent to DHCP. Further details are provided by the character string that appears after error code 563.
10.1 A List of Messages Warning Messages Code 600 601 610 611 612 614 615 Message Measured data and Settings have been initialized. Measured data have been initialized. This usernema is already registered. There is no user who can enter to the SETUP mode. Please acknowledge all active alarms before stopping this record. Calibration settings are reset because of range setting change. Noise may influence measurement in test mode. Ref. Section – – See section 8.2.
10.2 Troubleshooting Does not function (nothing is displayed). Is the power switch turned ON? Does the switch work properly? NO Turn ON the power properly. O.G. Connect properly. O.G. Supply the power at the specified voltage and frequency. O.G. YES Is the power supply connected properly? NO YES Is the power supplied properly? NO YES Contact your nearest YOKOGAWA dealer. O.G.
10.2 Troubleshooting 1 • Large measurement errors • Trend or digital wave value fluctuation • Trend going off the scale beyond either 0% or 100% 2 Does the input meet the specifications? NO Change the input wiring to meet the specifications. Section 12.
10.2 Troubleshooting Display and other functions do not work properly. Taking measures against noise? NO YES • Move the input and communication wires away from the noise source. • Ground the recorder. • Use shielded cables for input and communication wires. • Insert an isolation transformer into the power line. • Insert a power line filter into the power line. • If an inductive load is used in the alarm output line, insert a serge suppressor in the line. Contact your nearest YOKOGAWA dealer.
Chapter 11 Calibration 11.1 Periodic Inspection 1 Check the operation periodically to keep the DX in good working order. Perform the following checks and replace worn parts as needed. • Is the display and storage functioning properly? If not, see chapter 11, “Troubleshooting” in the DX1000/DX1000N User’s Manual. • Has the brightness of the LCD backlight deteriorated? If replacement is necessary, see “Recommended Replacement Periods for Worn Parts.
11.2 Calibrating the DX It is recommended that the DX be calibrated once a year to assure its measurement accuracy. Calibration service is also provided by YOKOGAWA dealers. For details, contact your nearest YOKOGAWA dealer. Required Instruments Calibration instruments with the following resolution are required for calibrating the DX. Recommended Instruments • DC voltage standard: • Decade resistance box: Fluke 9100 or equivalent Main specifications Output accuracy: ±(0.
11.2 Calibrating the DX Temperature Measurement When Using an RTD (Example for the DX1012) Input terminal 1 2 The resistance of three lead wires must be equal.
11.3 Pulling Out the Inner Instrument (DX1000N) The inner instrument of the DX1000N can be pulled out. Because some areas inside the DX have high voltages, be sure to pull out the inner instrument correctly. For the procedure, see the Daqstation DX1000/DX1000N/DX2000 Service Manual, SM 04L41B01-01E.
Chapter 12 Specifications 12.
12.1 Signal Input and Alarm Item Thermocouple burnout* Specifications Burnout upscale/downscale selectable (for each channel). Normal: 2 kΩ or less., Burnout: 100 kΩ or more (parallel capacitance of 0.01 µF or less) Detection current: Approx. 10 µA 1-5 range burnout* Burnout upscale/downscale selectable (for each channel).
12.2 Display Function 1 Display Item Display* Specifications 5.5-inch TFT color LCD (240 × 320 dots) Brightness 8 levels Backlight saver function Dim or turn off the LCD backlight if there is no key operation for a specified time. 2 * A section of the LCD monitor may contain pixels that are always on or off. The brightness of the LCD may also not be uniform due to the characteristics of the LCD. This is not a malfunction.
12.2 Display Function Information display Alarm summary display Displays a log of up to 1000 alarms. Specify an alarm with the cursor and jump to the corresponding section on the historical trend display. Message summary display Time and content of up to 450 messages (including 50 add messages) Specify a message with the cursor and jump to the corresponding section on the historical trend display. Memory summary display Displays the information of the data in the memory.
12.2 Display Function 1 Other Displayed Information Item Specifications Tag display Tag numbers and comments can be displayed. Tag numbers (release number 3 or later) Up to 16 characters Displayable characters: Alphanumeric characters Tag numbers can be enabled or disabled. Tag comments 32 characters on a DX with a release number of 3 or later. 16 characters on a DX with a release number of 2 or earlier.
12.3 Data Saving Function Configuration Item Internal memory Medium Specifications Temporarily saves various types of data. Flash memory External storage medium Medium Format CF card (up to 2 GB) FAT32 or FAT16 Data Type Item Specifications DX data types and file extensions Data Type Extension Display data Event data Manual sampled data Screen image data Setup data Report data Custom display setup data Change settings log data .DAD .DSD .DAE .DSE .DAM .PNG .PDL .PEL .DAR .xml .CDC .
12.
12.3 Data Saving Function Custom Display Setup Data Item Specifications Contents Format File name Save/load destination Custom display layout settings Text Up to 32 characters CF card Data File Loading Item Specifications Function Load and show the display data or event data in a CF card or USB flash memory (/USB1). Miscellaneous Item Specifications Header comment Add up to 50 characters of comment to display data, event data, manual sampled data, or report data file.
12.4 Other Standard Functions 1 Event Action Function Item Specifications Event action Execute a specified operation when a given event occurs. Number of settings 40 Events Timer Match time timer Remote control input, etc. Number of timers: 4 Number of timers: 4 Action Specify memory start/stop, alarm ACK, etc. There are limitations on the combinations of events and actions.
12.4 Other Standard Functions Communication Functions Item Specifications Electrical and mechanical specifications Conforms to IEEE 802.3 (Ethernet frames conform to the DIX specification). Medium Ethernet (10BASE-T) Implemented protocols TCP, IP, UDP, ICMP, ARP, DHCP, HTTP, FTP, SMTP, SNTP, Modbus, and DX-dedicated protocols E-mail client Automatically send e-mail at specified times. FTP client Automatically transfer data files to the FTP server.
12.5 Options 1 Alarm Output Relay (/A1, /A2, and /A3) Item Specifications Action Number of outputs Relay contact rating Output format Relay operation Outputs relay contact signals from the terminals on the rear panel when alarms occur. 2 outputs (/A1), 4 outputs (/A2), and 6 outputs (/A3) 250 VAC (50/60 Hz)/3 A, 250 VDC/0.1 A (for resistance load) NO-C-NC Energized/deenergized, AND/OR, hold/non-hold, and reflash settings are selectable.
12.5 Options Desktop Type (/H5[ ]) Item Specifications Construction With carrying handle. /H5D, /H5F, /H5R, /H5J, /H5H: Power Inlet connector. With a power cord. /H5: Can only be specified when /P1 is simultaneously specified. Screw type power terminal. Without power cord.
12.5 Options 1 Cu10, Cu25 RTD Input/3 Leg Isolated RTD Input (/N1) Item Function Specifications In addition to the standard input, the DX can also receive Cu10 and Cu25 input. On the DX1006, DX1012, DX1006N, and DX1012N, all the RTD input terminals (A, B,and b) are isolated on each channel. 2 Measurement/display accuracy Under standard operating conditions Input Type Setting Cu10 (GE) Cu1 Cu10 (L&N) Cu2 Cu10 (WEED) Cu3 Cu10 (BAILEY) Cu4 Cu10:α=0.00392 at 20°C Cu5 Cu10:α=0.
12.5 Options 3 Leg Isolated RTD Input (/N2) Item Specifications Input terminal All the RTD input terminals (A, B, and b) are isolated on each channel. Applies to DX1006, DX1012, DX1006N, and DX1012N Note: On the DX2004 and DX2008 standard models, all the terminals (A, B, and b) are already isolated on each channel Extended Input Type (/N3) Item Specifications Measurement/display accuracy Under standard operating conditions Input Type Measurement Range Kp vs Au7Fe 0.0 to 300.0K PLATINEL 0.
12.5 Options 1 Remote Control (/R1) Item Specifications Number of input terminals 8 Input type Isolated from the main circuitry through a photocoupler, built-in isolated power supply for the input terminals, and shared common. Input type and signal level Voltage-free contact Contact closed at 200 Ω or less and contact open at 100 kΩ or greater. The remote contact input operation can be set to normal open or normal close (release number 3 or later) Open collector ON voltage: 0.
12.5 Options USB Interface (/USB1) Item USB port Specifications Complies with Rev. 1.1 and host function Number of ports 2 (one each on the front panel and rear panel) Power supply 5 V , 500 mA (per port) Devices which need more than 500 mA total bus power for 2 ports can not be connected at the same time. Connectable devices Only connect the devices listed below to prevent damage to the devices. Keyboard Complies with HID Class Ver. 1.
12.5 Options 1 DC/AC 24 V power supply (/P1) Item Specifications Rated supply voltage 24 VDC and 24 VAC (50/60Hz) Allowable power supply voltage range 21.6V to 26.4 VDC/AC Insulation resistance Between power terminal and earth: 20 MΩor greater at 500 VDC.
12.5 Options Advanced Security Function (/AS1; release numbers 4 and later) Item Login function Administrators Users User identification Password management function Specifications Only registered users can operate the DX.
12.6 General Specifications 1 Construction Item Mounting Mounting angle Allowable panel thickness Material Color Front panel External dimensions Weight Specifications Flush panel mounting (on a vertical plane) (excluding the desktop type) Inclined backward up to 30 degrees from a horizontal plane. 2 to 26 mm Case: Metal plate Bezel and display cover: Polycarbonate Case: Grayish blue green (Munsell 2.0B5.0/1.7 or equivalent) Bezel: Charcoal gray light (Munsell 10B3.6/0.
12.6 General Specifications Transport and Storage Conditions Item Ambient temperature Ambient humidity Vibration Shock Specifications –25 to 60°C 5 to 95%RH (no condensation) 2 10 to 60 Hz, 4.9 m/s maximum 2 392 m/s maximum (in packaged condition) Supported Standards Item CSA UL CE EMC directive Low voltage directive C-Tick *1 *2 *3 Specifications *1 *2 *3 CSA22.2 No.61010.
12.6 General Specifications 1 Standard Performance Item Specifications Measurement/display accuracy Standard operating conditions: Temperature: 23 ± 2°C Humidity: 55% ± 10%RH Power supply voltage: 90 to 132 or 180 to 250 VAC Power supply frequency: 50/60 Hz ± 1% Warm-up time: At least 30 minutes. Other ambient conditions such as vibration should not adversely affect the operation.
12.6 General Specifications Item Specifications Measuring accuracy in case of scaling Accuracy during scaling (digits) = measurement accuracy (digits) × multiplier + 2 digits (rounded up) * Fractions rounded up where the multiplier = scaling span (digits)/measuring span (digits). Example For 1-5 V range (A/D integration time is 16.7 ms or more), measurement span of 1.000 to 5.000 V, and scaling span of 0.000 to 2.000 The measuring accuracy for 5 V input is as follows.
12.
12.7 External Dimensions See the DX1000/DX1000N Operation Guide (IM04L41B01-02E).
Appendix Appendix 1 File Size of Display Data and Event Data This section explains how to calculate the file size of display data files and event data files. The calculation examples are given for the display data only and event data only cases. If you are recording both display and event data, calculate the data size of each and add them together. Use the calculated file size as a rough guide. These calculation examples only apply to DXs that do not have the /AS1 advanced security option.
Appendix 1 File Size of Display Data and Event Data • Sampled Data Size per File Display Data Data size per sample × file save interval/sampling interval The sampling interval is determined by dividing the trend interval (in seconds) by 30 (40 if the trend interval is 5 or 10 s).
Appendix 1 File Size of Display Data and Event Data Save Duration to the CF Card We will estimate the duration over which measured data can be saved to a CF card when measured data is being saved automatically. Display Data Save duration to the CF card (estimate) = (Size of the CF card/size of a file)×[file save interval] Example 6: We will estimate the save duration to the CF card under the conditions of examples 1 and 2. In this example, the size of the CF card is assumed to be 256 MB. 256 MB/0.
Appendix 2 Types of Data FilesThat the DX Can Create and Their Application This section explains the types of data files that the DX can create and their application.
Appendix 3 Text File Data Format 1 This section explains the format of text files. The text files that the DX can create are manual sampled data files and report files. In the explanation below, CRLF represents a terminator. Format of the Manual Sample Data File • The manual sampled data is output using numerical values and strings in text format delimited by tabs. • Values of measurement channels set to Skip and computation channels set to Off are not output.
Appendix 3 Text File Data Format File Output Example Below is a manual sample data example of channels 1, 2, 3, and 4. YREC Manual Sample Data Model Language Code File Status Serial No. File Header Ch Ch Id Tag Unit 2005/10/01 08:57:22 2005/10/01 08:57:28 Version 1.02.00 DX1000 shift-JIS Progress S5E701600 CH001 TI-101 abc °C 213.8 208.6 CH002 OUT-102 def V 0.517 0.494 CH003 FI-103 hij m3/h 368.4 363.0 CH004 VA-204 klmn % 68.9 68.
Appendix 3 Text File Data Format Report File Format • The hourly, daily, weekly, and monthly reports are output using numeric values and strings in text format delimited by tabs. • Values of measurement channels set to Skip and computation channels set to Off are not output. • The data is appended to this file every time a report is created. YRECCRLF Report Data Model Language Code File Status Serial No.
Appendix 3 Text File Data Format rrr···r Contents of the report file (13 characters) Hourly Daily Hourly+Daily Daily+Weekly Daily+Monthly When the DX is set to Hourly+Daily and Combine, Hourly+Daily is output. When the DX is set to Hourly+Daily and Separate, the hourly report is output as Hourly, and the daily report as Daily.
Appendix 3 Text File Data Format File Output Example Below is an example of an hourly report of 4 channels while creating hourly and daily reports and saving each type of report to a separate file. YREC Report Data Model Language Code File Status Serial No. File Header Report Set File Data Math Set Start Time Ch Id Tag Unit Data Type Time Status Ave Max Min Sum 2 Version 1.02.
Appendix 3 Text File Data Format Note • When the channel data is in the condition shown in the table below, the Er, Ov, or Bo status is output to a report. Data Condition Status Error Er Measurement channels Positive over range Negative over range Burn out detection Ov Ov Bo Computation channels Ov Positive computation overflow (when the value exceeds 1.79E + 308) Negative computation overflow (when the value falls below –1.
Appendix 3 Text File Data Format 1 Format of the Change Settings Log (/AS1 option) • The change settings log is output as a tab-separated text file. • Each time a report is created, data is added to the file. 2 Format YRECCRLF Setting Change Data Version 1.00.00CRLF File Status ffffffffCRLF Serial No.
Appendix 3 Text File Data Format File Output Example Below is an example of a change settings log file with two change settings log entries. YREC Setting Change Data Version 1.00.00 File Status Progress Serial No. S5H907377 Changed 2010/04/01 00:55:44 Sys Contents File Info 209 40100550.PEL User Info Manual KEY Changed 2010/04/02 00:56:18 Contents Login File Info 210 40100560.
Index Index Symbol **.............................................................................................. 9-6 +Over..................................................................................... 1-15 -Over...................................................................................... 1-15 [a?b:c].................................................................................... 9-10 24 VDC transmitter power supply........................................ 12-15 24 V power supply......
Index delay high limit alarm............................................................... 1-4 delay low limit alarm................................................................ 1-4 deleting a file......................................................................... 6-17 desktop type........................................................................ 12-12 detect (alarm hide function)................................................... 3-14 DHCP log................................................
Index loading a template file........................................................... 6-22 loading setup data................................................................. 6-21 LOG......................................................................................... 9-6 log display............................................................................. 1-24 logging in................................................................................. 8-6 logging out...............................
Index revisions...................................................................................... ii rolling average............................................................... 1-47, 9-4 RS-232 interface..................................................................12-11 RS-422A/485 interface.........................................................12-11 S sample rate.............................................................................. 6-3 save directory...................................