
User's Manual

Chapter 8 Dashboard
ZyWALL USG 20/20W User’s Guide
173
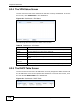
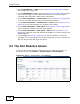
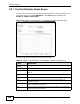
8.2.3 The Active Sessions Screen
Use this screen to look at a chart of the ZyWALL’s recent traffic session usage. To
access this screen, click Session Usage in the dashboard.
Figure 131 Dashboard > Session Usage
The following table describes the labels in this screen.
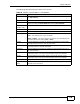
Table 22 Dashboard > Session Usage
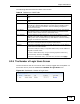
LABEL DESCRIPTION
Sessions The y-axis represents the number of session.
The x-axis shows the time period over which the session usage occurred
Refresh
Interval
Enter how often you want this window to be automatically updated.
Refresh Click this to update the information in the window right away.