
Improving the performance of single instance Oracle on file systems, January 2008


7
The mount options used in these experiments are as follows:
Table 2 Online JFS mount options used
Option Meaning
ioerror=mwdisable
This option (meta-data write disable) is the default policy for handling I/O errors. On meta-data
write errors, the file system would be disabled; otherwise, it is degraded.
qio
By default, Quick I/O is enabled, meaning that any Quick I/O files are recognized as such by the
file system. When ODM is enabled, use this default setting to ensure ODM functions correctly in
the mounted file system.
log
This intent logging option means that all structural changes to the file system are guaranteed to be
written to the disk before the system call returns.
nodatainlog
Logging of synchronous writes is disabled and writes of data into the file and updates of inode
data occur synchronously.
mincache=direct
This enables direct I/O, bypassing the UNIX® buffer cache. This eliminates double-buffering of
data, where data is copied between the UNIX buffer cache and the Oracle buffer cache, which is
a portion of the System Global Area (SGA).
convosync=direct
Delay inode updates for writes to files for data base files.
Although a customer can choose a different set of mount options, a key performance choice is to
bypass double-buffering, which can greatly affect overall performance because data is copied
between the HP-UX buffer cache and the Oracle buffer cache in the SGA. In this benchmark, the goal
was to keep these settings constant between tests so that results could be accurately compared.
Experimental configuration
Many factors can affect the performance of a single-instance Oracle database installation. The first
objective was to find a balanced configuration and to establish a setup where the overall throughput
of the system was only limited by the CPU of the SUT or by the I/O subsystem being studied.
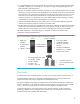
The OLTP application simulates an order-entry workload and was chosen for the following reasons:
• For its ability to make controlled, step-wise increases in application load to enable measurement of
the database response in TPMs
• To put stress on the I/O subsystem under test
The TPM is a measure of how well the system can convert user CPU cycles into effective throughput.
This workload has a read/write ratio, oscillating between 59%/41% and 52%/48%, with the high
write ratio helping to stress the I/O subsystem.
This workload might also represent some customer database environments, although each production
environment has its own unique pattern.
The experimental configuration included the following factors:
• The SUT needed sufficient physical memory and CPU to run the single-instance Oracle database
server. The Oracle 9i and 10g benchmarks used the same four-way rx4640 running HP-UX 11i v2
with 16 GB of physical memory.
• In an OLTP environment, the server running the client driver needed sufficient memory and CPU to
generate a workload that could stress the SUT. For the Oracle 9i benchmark, we used an eight-way
N-4000 (PA) system
6
with 4 GB of physical memory running HP-UX 11i v2. User CPU utilization of
the driver did not exceed 20% at the highest workload of the best-performing configuration.
6
For the Oracle 10g10gR2 benchmark, a different driver was set up. The Oracle 10g driver was a revised version of the same OLTP application
used in the Oracle 9i benchmark, but it had to be run on an Integrity server. For this, we used a four-way rx4640, running HP-UX 11i v2.