
HP Process Resource Manager User's Guide


Fine-tuning your PRM configuration
Using prmanalyze to analyze your configuration
Chapter 8164
Example: Locating system bottlenecks
The first example shows how one might locate system bottlenecks and
fine-tune a configuration with the aid of prmanalyze special reports.
Many of the interactive users assigned to the group OTHERS have
complained that the system response time is terrible in the afternoons.
The administrator examines the summary reports generated by
prmanalyze, but sees nothing out of the ordinary. The administrator
then looks more closely at CPU resource use:
# prmanalyze -r cpu -1 -t hourly -s prmid myacct
The CPU hourly report, however, is normal. The OTHERS group is getting
plenty of CPU resources at all times. It has shares equaling 25%, but
never demands more than 15%. So CPU resources are not the problem.
Next, examine memory:
# prmanalyze -r mem -E -1 -t hourly -s prmid myacct
The memory report does show that OTHERS is peaking out on memory use
around 3pm. The administrator then generates the same memory report,
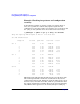
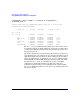
filtering out the known applications:
# prmanalyze -r mem -E -1 -t hourly -x web_browser -x
financials -x mrkt_rsch -x sales_fcst myacct
sorting chronological events
hourly memory report by command name begins at Wed Jul 7 15:27:00 1999
ave KB mem threshold 0.01
unique id ave KB peak KB KB minutes % total
Jul 7 15:00 51976.33 1.725E+05 3.119E+06
mail_reader 1082.25 3.861E+03 6.494E+04 2.08
java 608.99 1.107E+03 3.654E+04 1.17
debugger 50031.32 1.678E+05 3.002E+06 96.26
This report shows a debugger application consuming almost all the
memory in OTHERS. This prevents other users from getting useful work
done. The administrator can use acctcom to find the user running the
debugger. If this user is a developer trying to locate a bug in the sales
database program, change the user record to place him in the Sales