
Installation guide


36 Chapter 2. The proc File System
2.2.26. /proc/slabinfo
This file gives information about memory usage on the slab level. Linux kernels greater than 2.2 use
slab pools to manage memory above the page level. Commonly used objects have their own slab
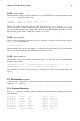
pools. The following is a portion of a typical /proc/slabinfo virtual file:
slabinfo - version: 1.1
kmem_cache 64 68 112 2 2 1
nfs_write_data 0 0 384 0 0 1
nfs_read_data 0 160 384 0 16 1
nfs_page 0 200 96 0 5 1
ip_fib_hash 10 113 32 1 1 1
journal_head 51 7020 48 2 90 1
revoke_table 2 253 12 1 1 1
revoke_record 0 0 32 0 0 1
clip_arp_cache 0 0 128 0 0 1
ip_mrt_cache 0 0 96 0 0 1
The values in this file occur in the following order: cache name, number of active objects, number of
total objects, size of the object, number of active slabs (blocks) of the objects, total number of slabs
of the objects, and the number of pages per slab.
Note that active in this case means an object is in use. Therefore an active object is one that is in use,
and an active slab is one that contains one or more active object.
2.2.27. /proc/stat
This file keeps track of a variety of different statistics about the system since it was last restarted. The
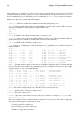
contents of /proc/stat, which can be quite long, begins something like this:
cpu 1139111 3689 234449 84378914
cpu0 1139111 3689 234449 84378914
page 2675248 8567956
swap 10022 19226
intr 93326523 85756163 174412 0 3 3 0 6 0 1 0 428620 0 60330 0 1368304 5538681
disk_io: (3,0):(1408049,445601,5349480,962448,17135856)
ctxt 27269477
btime 886490134
processes 206458
Some of the more popular statistics include:
• cpu — Measures the number of jiffies (1/100 of a second) that the system has been in user mode,
user mode with low priority (nice), system mode, and the idle task, respectively. The total for all
CPUs is given at the top, and each individual CPU is listed below with its own statistics.
• page — The number of memory pages the system has written in and out to disk.
• swap — The number of swap pages the system has brought in and out.
• intr — The number of interrupts the system has experienced.
• btime — The boot time, measured in the number of seconds since January 1, 1970, otherwise
known as the epoch.