
Computer Hardware User Manual


SPRAA56
24 DSP/BIOS Real-Time Analysis (RTA) and Debugging Applied to a Video Application
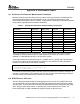
In the input and output tasks, Cell0 is the color conversion routine. In the processing task, Cell0
is the encoder and Cell1 is the decoder. The expected values for color conversion routines are
given as 2-5 ms, typical values for an optimized color conversion routine. Where no expected
value was available, the expected value is "—".
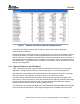
Table 1. Expected and Measured STS Benchmarks
STS Benchmark Expected Value Measured Value Your Measurement
tskInput 100s of cycles 60,472 instructions
tskOutput 100s of cycles 11,482,597 instructions
tskVideoProcess 100s of cycles 24,308 instructions
tskControl 100s of cycles 702,097 instructions
stsInVidPeriod 33.33ms 33.26 ms
stsInVidTotal — 1.95 ms
stsInVidCell0 2-5ms 1.95 ms
stsInVidWait0 <stsOutVidCell0> 4.75 ms
stsInVidBusUtil — 28,512,000 Bps
stsOutVidPeriod 33.33ms 33.29 ms
stsOutVidTotal — 2.43 ms
stsOutVidCell0 2-5ms 2.41 ms
stsOutVidWait0 <33ms 30.35 ms
stsOutVidBusUtil — 28,512,000 Bps
stsProcPeriod 33.33ms 33.26 ms
stsProcTotal Cell0 + Cell1 24.07 ms
stsProcCell0 — 18.97 ms
stsProcCell1 — 5.09 ms
stsProcNframes 1 second (30 frames) 498.84 ms
stsProcBusUtil — 26,926,600 Bps
The typical expected values for task scheduling latency are on the order of a few hundred
cycles, so those benchmarks were gathered in units of instructions rather than milliseconds.
Because of the architecture of the video example, where the data tasks all have equal priority,
the processing and output task can spend significant time waiting on tasks that are already
running. This skews the scheduling latency benchmark higher for all three of the data stream
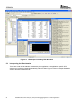
tasks (tskInput, tskOutput, and tskVideoProcess). This can be observed in the Execution Graph
by noting the amount of time the tasks remain in the ready state while waiting for currently
executing tasks to complete.