
User`s guide


plot
4-118
4plot
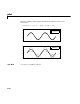
Purpose Plot data, fit, prediction bounds, outliers, and residuals
Syntax plot(fresult)
plot(fresult,xdata,ydata)
plot(fresult,xdata,ydata,'s')
plot(fresult,'s1',xdata,ydata,'s2')
plot(fresult,xdata,ydata,outliers)
plot(fresult,xdata,ydata,outliers,'s')
plot(...,'ptype1','ptype2',...)
plot(...,'ptype1','ptype2',...,conflev)
h = plot(…)
Arguments
Description
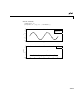
plot(fresult) plots the fit result object fresult. fresult is a fit result object
generated by the
fit function.
plot(fresult,xdata,ydata) plots the fit result object, the predictor data
specified by
xdata, and the response data specified by ydata.
plot(fresult,xdata,ydata,'s') plots the predictor and response data using
the color, symbol, and line type specified by the string
s. Refer to the built-in
plot function for color, symbol, and line type options.
fresult A fit result object.
xdata A column vector of predictor data.
ydata A column vector of response data.
s,s1,s2 The plot symbols, plot colors, and line type.
outliers A vector of outliers.
'ptype' The plot type. You can specify multiple plot types as a cell
array of strings.
conflev The confidence level.
h A vector of plot handles.