
User`s guide


1 Getting Started with the Curve Fitting Toolbox
1-8
When you fit higher degree polynomials, the Results area displays this
warning:
Equation is badly conditioned. Remove repeated data points
or try centering and scaling.
The warning arises because the fitting procedure uses the cdate values as the
basis for a matrix with very large values. The spread of the
cdate values
results in scaling problems. To address this problem, you can normalize the
cdate data. Normalization is a process of scaling the predictor data to improve
the accuracy of the subsequent numeric computations. A way to normalize
cdate is to center it at zero mean and scale it to unit standard deviation.
(cdate - mean(cdate))./std(cdate)
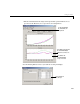
To normalize data with the Curve Fitting Tool, select the Center and scale X
data
check box.
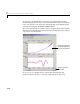
Note Because the predictor data changes after normalizing, the values of the
fitted coefficients also change when compared to the original data. However,
the functional form of the data and the resulting goodness of fit statistics do
not change. Additionally, the data is displayed in the Curve Fitting Tool using
the original scale.
Determining the Best Fit
To determine the best fit, you should examine both the graphical and
numerical fit results.
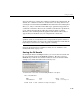
Examining the Graphical Fit Results
Your initial approach in determining the best fit should be a graphical
examination of the fits and residuals. The graphical fit results shown below
indicate that
• The fits and residuals for the polynomial equations are all similar, making it
difficult to choose the best one.