
User`s guide


1 Getting Started with the Curve Fitting Toolbox
1-12
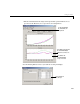
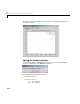
The numerical fit results are shown below. You can click the Table of Fits
column headings to sort by statistics results.
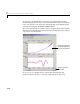
The SSE for
exp1 indicates it is a poor fit, which was already determined by
examining the fit and residuals. The lowest SSE value is associated with
poly6.
However, the behavior of this fit beyond the data range makes it a poor choice
for extrapolation. The next best SSE value is associated with the fifth degree
polynomial fit,
poly5, suggesting it may be the best fit. However, the SSE and
adjusted R-square values for the remaining polynomial fits are all very close to
each other. Which one should you choose?
Click this column heading to sort
the fits by the SSE values.
The SSE and adjusted R-square
values suggest that the fifth degree
polynomial fit is the best one.
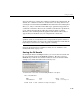
The confidence bounds for the p1-p3
coefficients suggest that a fifth degree
polynomial overfits the census data.