
User`s guide


Excluding and Sectioning Data
2-35
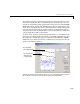
Viewing the Exclusion Rule
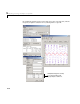
To view the exclusion rule, select an existing exclusion rule name and click the
View button. The View Exclusion Rule GUI shown below displays the modified
ENSO data set and the excluded data points, which are grayed in the table.
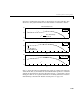
Example: Sectioning Periodic Data
For all parametric equations, the toolbox provides coefficient starting values.
For certain types of data sets such as periodic data containing many periods,
the starting values may not lead to satisfactory results. In this case, sectioning
the data can provide you with improved starting values for the fit.
This example uses generated sine data with noise added. The time vector is
given by
t and the amplitude, frequency, and phase constant of the data are
given by the vector
cf.
rand('state',0);
t = [0:0.005:1.0]';
cf = [10 16*pi pi/4];
noisysine = cf(1)*(sin(cf(2)*t+cf(3))) + (rand(size(t))-0.5);
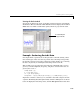
Import the variables t and noisysine, and fit the data with a single-term sine
equation. The Fitting GUI, Fit Options GUI, and Curve Fitting Tool are shown
below. To display the fit starting values, click the
Fit options button. Note that
The excluded data points
are grayed in the table.